
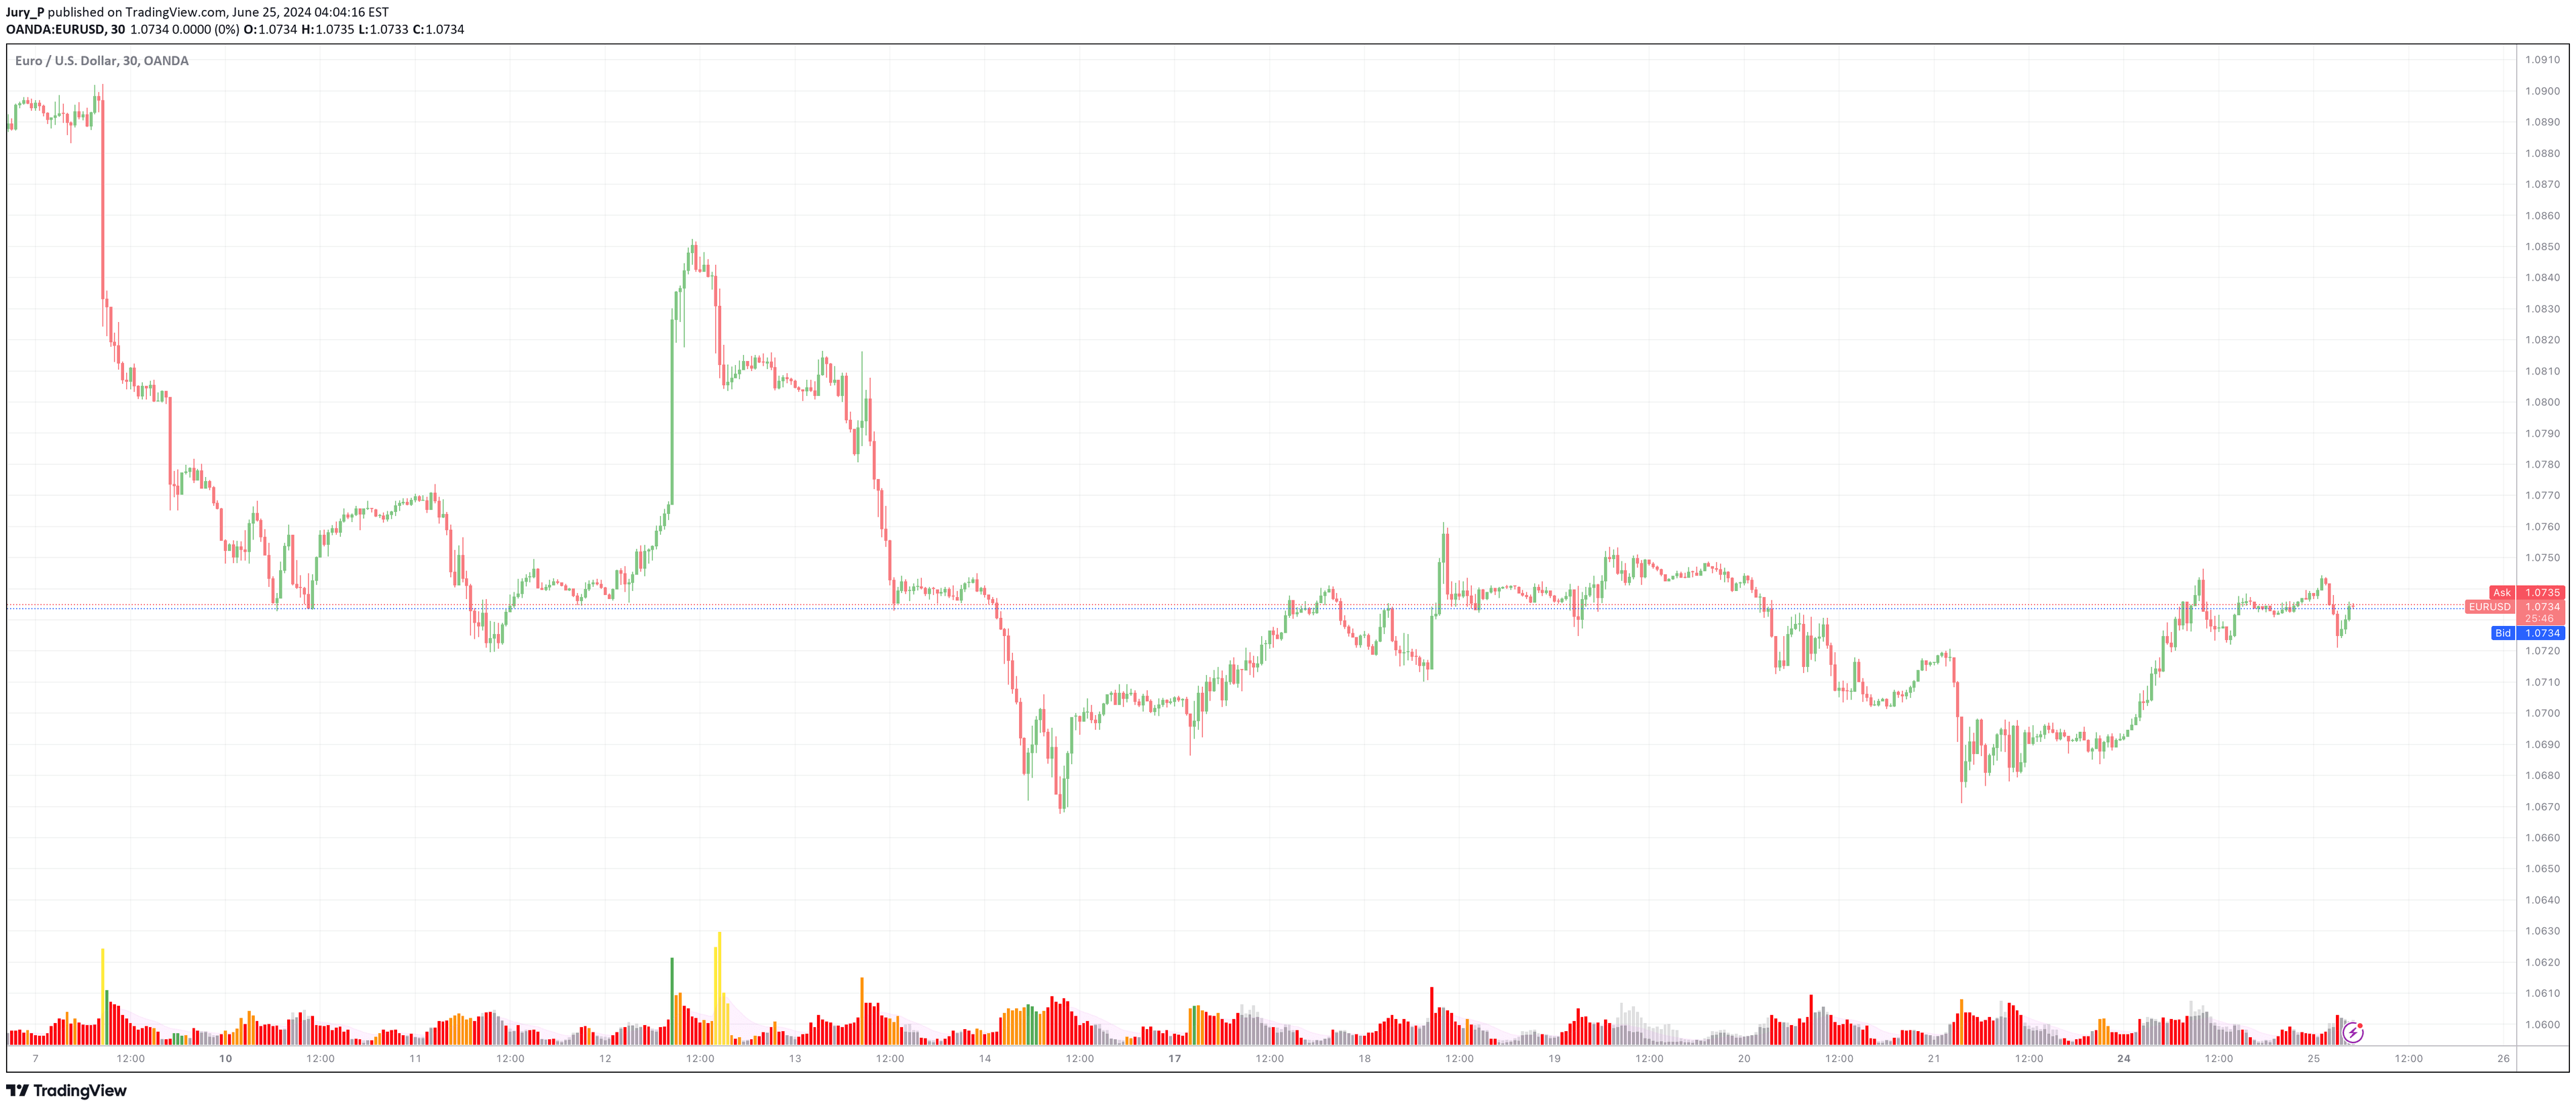
A multi-exchange volume indicator that aggregates trading volume across exchanges, visualizing relative volume through color-coded bars and providing insights into market activity.
Explore complementary indicator rolesHow it works
The Multi Exchange Relative Volume indicator collects volume data from up to five different exchanges, aggregating and analyzing the total market activity. It calculates the average volume over a customizable lookback period, comparing current volume against historical baselines.
The indicator then visualizes this data through color-coded volume bars, representing different volume intensity levels. An exponential moving average (EMA) is applied to smooth out short-term fluctuations, helping traders identify more sustained volume trends across multiple market platforms.
Why it may be useful
This indicator provides traders with a comprehensive view of market activity by synthesizing volume data from multiple exchanges, which is crucial in decentralized markets like cryptocurrency and forex. By offering a holistic perspective, traders can detect volume anomalies and potential market movements that might be missed when examining individual exchanges.
The color-coded visualization and EMA line make it easier to quickly interpret complex volume information, helping traders make more informed decisions about market momentum and potential trading opportunities.
When to explore it
The Multi Exchange Relative Volume indicator is most effective in volatile, decentralized markets where trading volume is spread across multiple platforms. It works best when traders want to identify significant volume shifts, potential breakout points, or unusual market activity that could signal important trend changes.
Traders should use this indicator during periods of market uncertainty, when comparing volume across different exchanges can provide deeper insights into overall market sentiment and potential price movements.
Keep exploring
What we’ve verified
Access, alerts and repainting behaviour have not been independently verified for this indicator. Check the creator’s current publication and settings.
General descriptions and classifications are recovered research. Verified details above identify the specific checks we have completed. Check the creator’s current publication for later changes.


