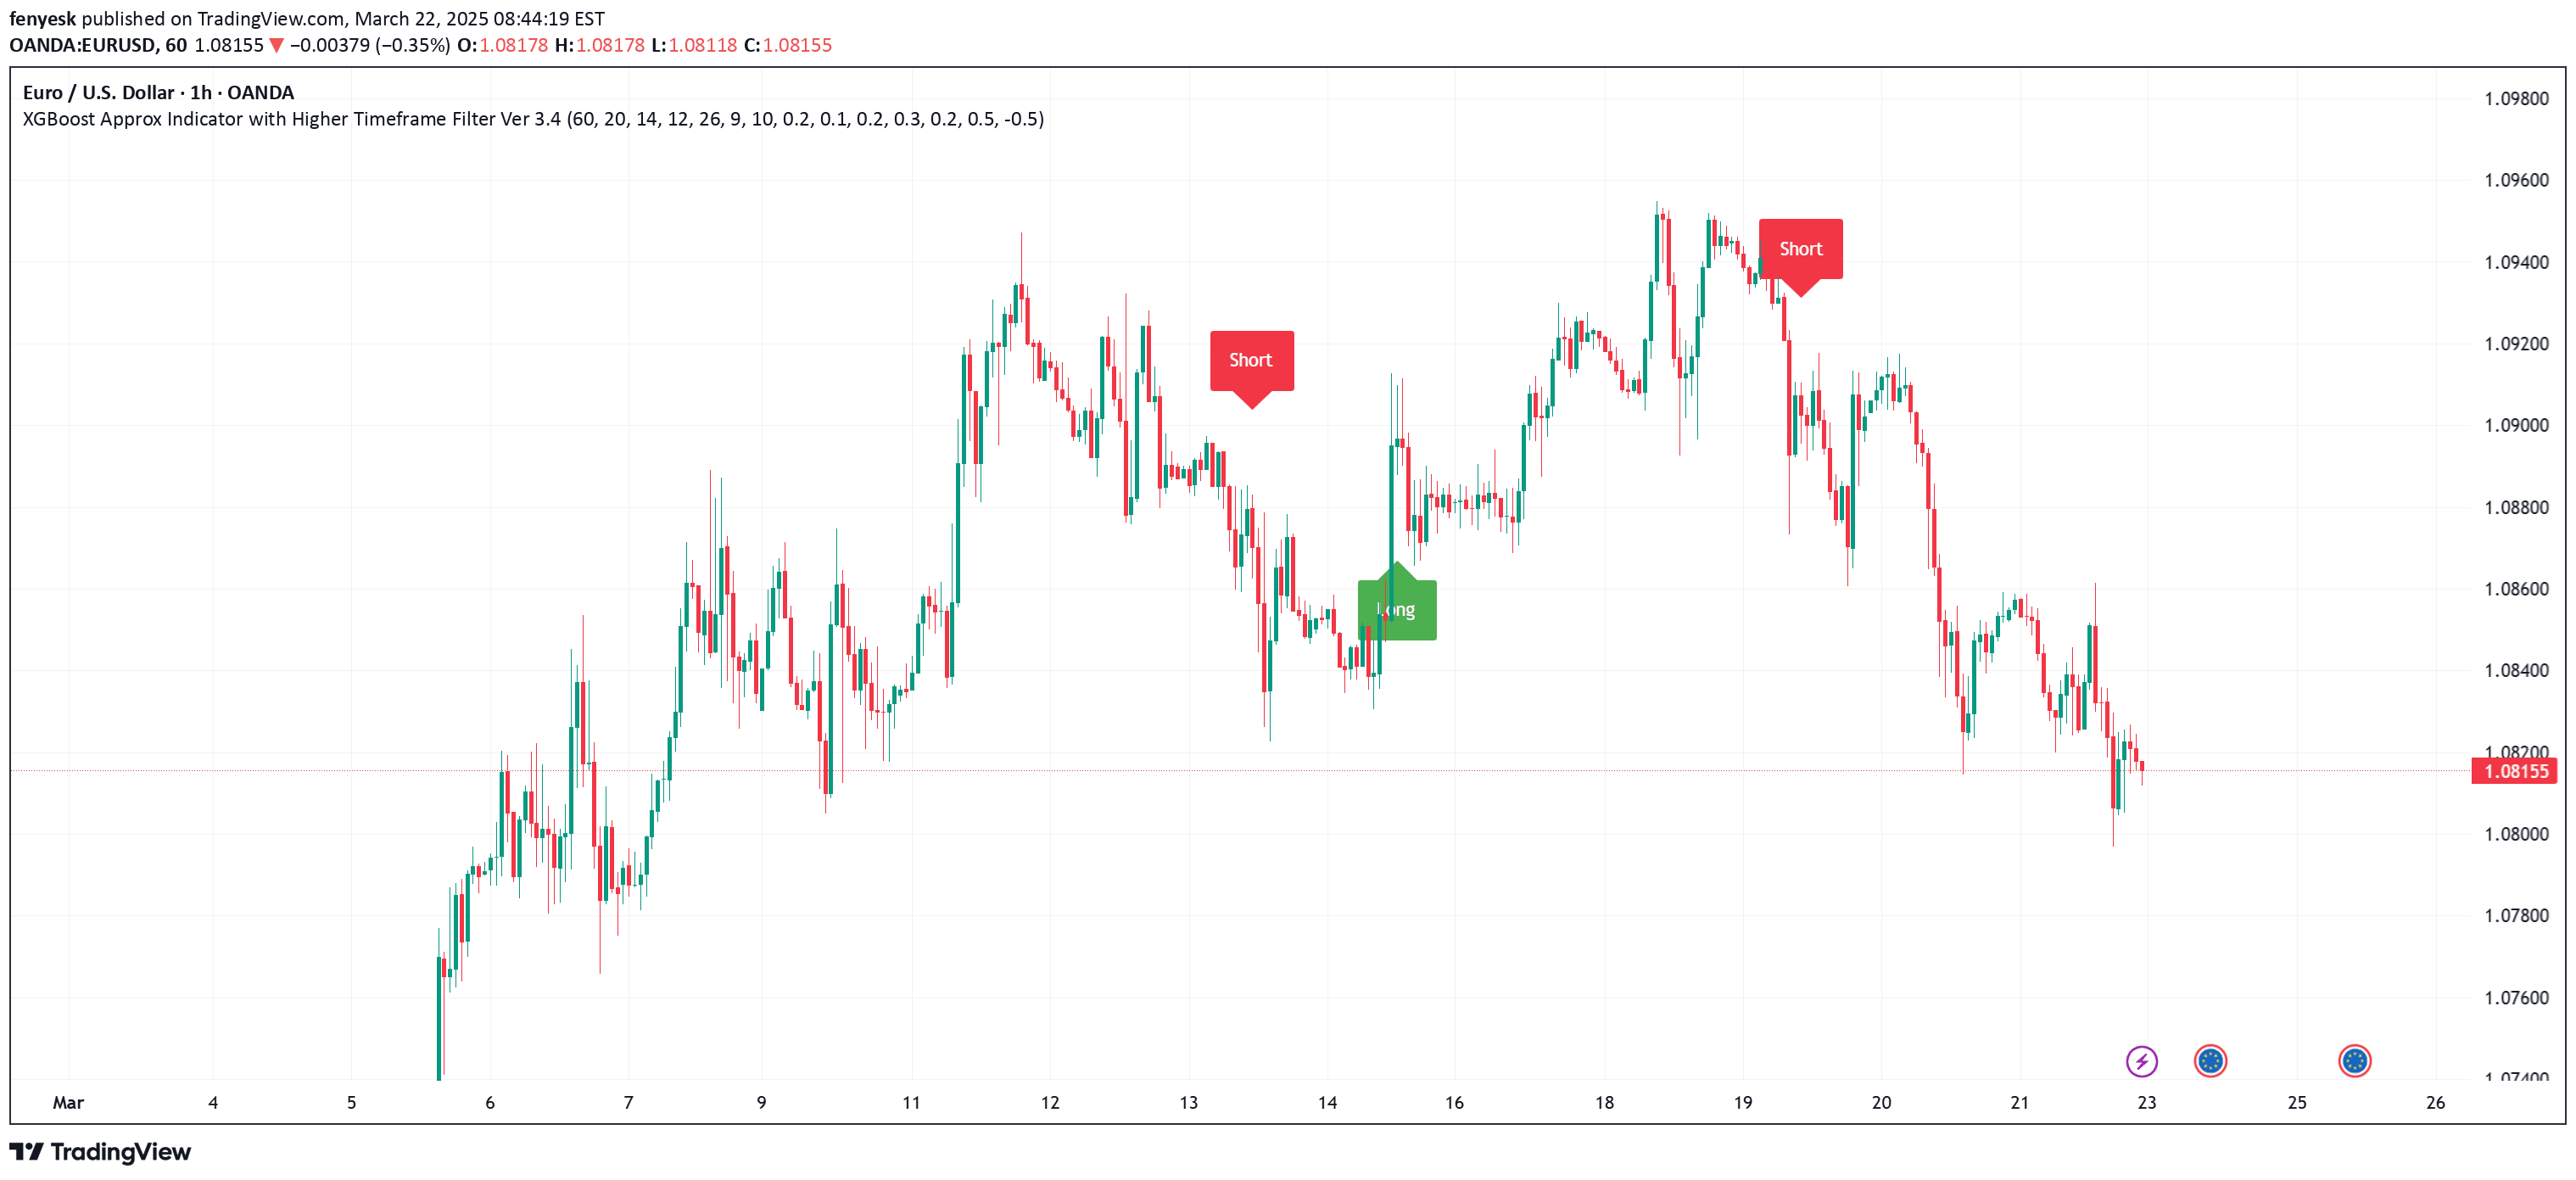
A combined technical analysis indicator using Smart Money Index and True Strength Index to identify potential entry and exit points by measuring market trend strength and large player activity.
Explore complementary indicator rolesHow it works
The Smart Money Index + True Strength Index indicator combines two technical analysis methods to generate trading signals. The Smart Money Index calculates the difference between closing and opening prices multiplied by trading volume, which helps assess large market player activities over a specified period.
By averaging these price-volume differences, traders can identify potential market trends and significant trading activities. The True Strength Index complements this by measuring trend strength through price change comparisons using exponential moving averages. It smooths price changes using two EMA lengths, creating an oscillator that fluctuates around zero and provides insights into potential market corrections and trend momentum.
Why it may be useful
This combined indicator offers traders a comprehensive approach to market analysis by integrating volume-based and momentum-based signals. By simultaneously examining smart money activity and trend strength, traders can make more informed decisions about potential market movements and reduce the likelihood of false signals that might occur when relying on a single indicator.
The dual-indicator approach provides enhanced analytical depth, allowing traders to validate signals across different market dimensions. It helps identify not just price trends, but also the underlying market sentiment and potential shifts in institutional trading behavior.
When to explore it
The Smart Money Index + True Strength Index is most effective in markets with clear directional movements and significant trading volume. It works particularly well in liquid markets like major forex pairs, stock indices, and heavily traded commodities where institutional investor activities are more pronounced and detectable.
Traders should preferentially use this indicator during periods of moderate to high market volatility, where trend changes are more likely and volume signals are more meaningful. It is especially useful for short to medium-term trading strategies that aim to capture momentum-driven price movements.
Keep exploring
What we’ve verified
Access, alerts and repainting behaviour have not been independently verified for this indicator. Check the creator’s current publication and settings.
General descriptions and classifications are recovered research. Verified details above identify the specific checks we have completed. Check the creator’s current publication for later changes.