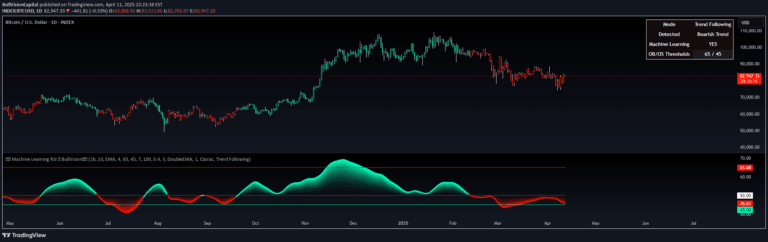
RSI (Kernel Optimized) | Flux Charts
A specialized RSI indicator using Kernel Density Estimation to predict potential pivot points by analyzing historical RSI patterns and calculating probability of price reversals.
Explore 11,183 indicators. Filter beyond the obvious.
Discover the tools that fit the way you trade.
11,183 tools to explore
A specialized RSI indicator using Kernel Density Estimation to predict potential pivot points by analyzing historical RSI patterns and calculating probability of price reversals.
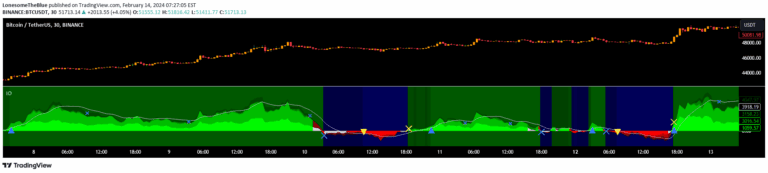
A sophisticated RSI indicator that uses machine learning and K-Nearest Neighbors to dynamically adapt momentum analysis by comparing current market conditions with historical patterns.
Ichimoku Oscillator is a multi-layered technical analysis tool that evaluates market trends using Ichimoku Cloud features, providing insights into potential entry and exit points.
QQE Weighted Oscillator is an advanced RSI-based indicator that provides trend reversal signals by weighting the RSI with a dynamic trailing stop mechanism.
RSI Primed combines candlestick visualization techniques with RSI to provide advanced market trend analysis and momentum insights across multiple charting modes.
The Relative Trend Index (RTI) is an advanced technical indicator that measures trend strength by analyzing price positioning within its recent range, offering more adaptive insights than traditional momentum tools.
A sophisticated technical analysis tool combining RSI, Discontinued Signal Lines, and ZLEMA to identify market trends, momentum, and potential reversals with adaptive signal generation.
An advanced MACD indicator that analyzes positive and negative waves to filter false crossover signals and provide enhanced trading insights through wave height analysis.
Cosine Kernel Regressions use advanced mathematical techniques to analyze market trends, providing smoothed insights into price movements through multi-indicator kernel regression.
A technical analysis method identifying divergences between price action and indicators to predict potential trend reversals or continuations in stock trading.
A sophisticated trend analysis tool using Inverse Fisher Transform and Butterworth filter to detect market momentum through multiple smoothed oscillators and dynamic volatility bands.
StochRSI Zenith is a sophisticated technical indicator that combines Stochastic RSI with advanced visualization and multi-timeframe analysis for comprehensive market condition assessment.
Likes, views, and comments are historical TradingView snapshots. They describe attention, not trading performance.