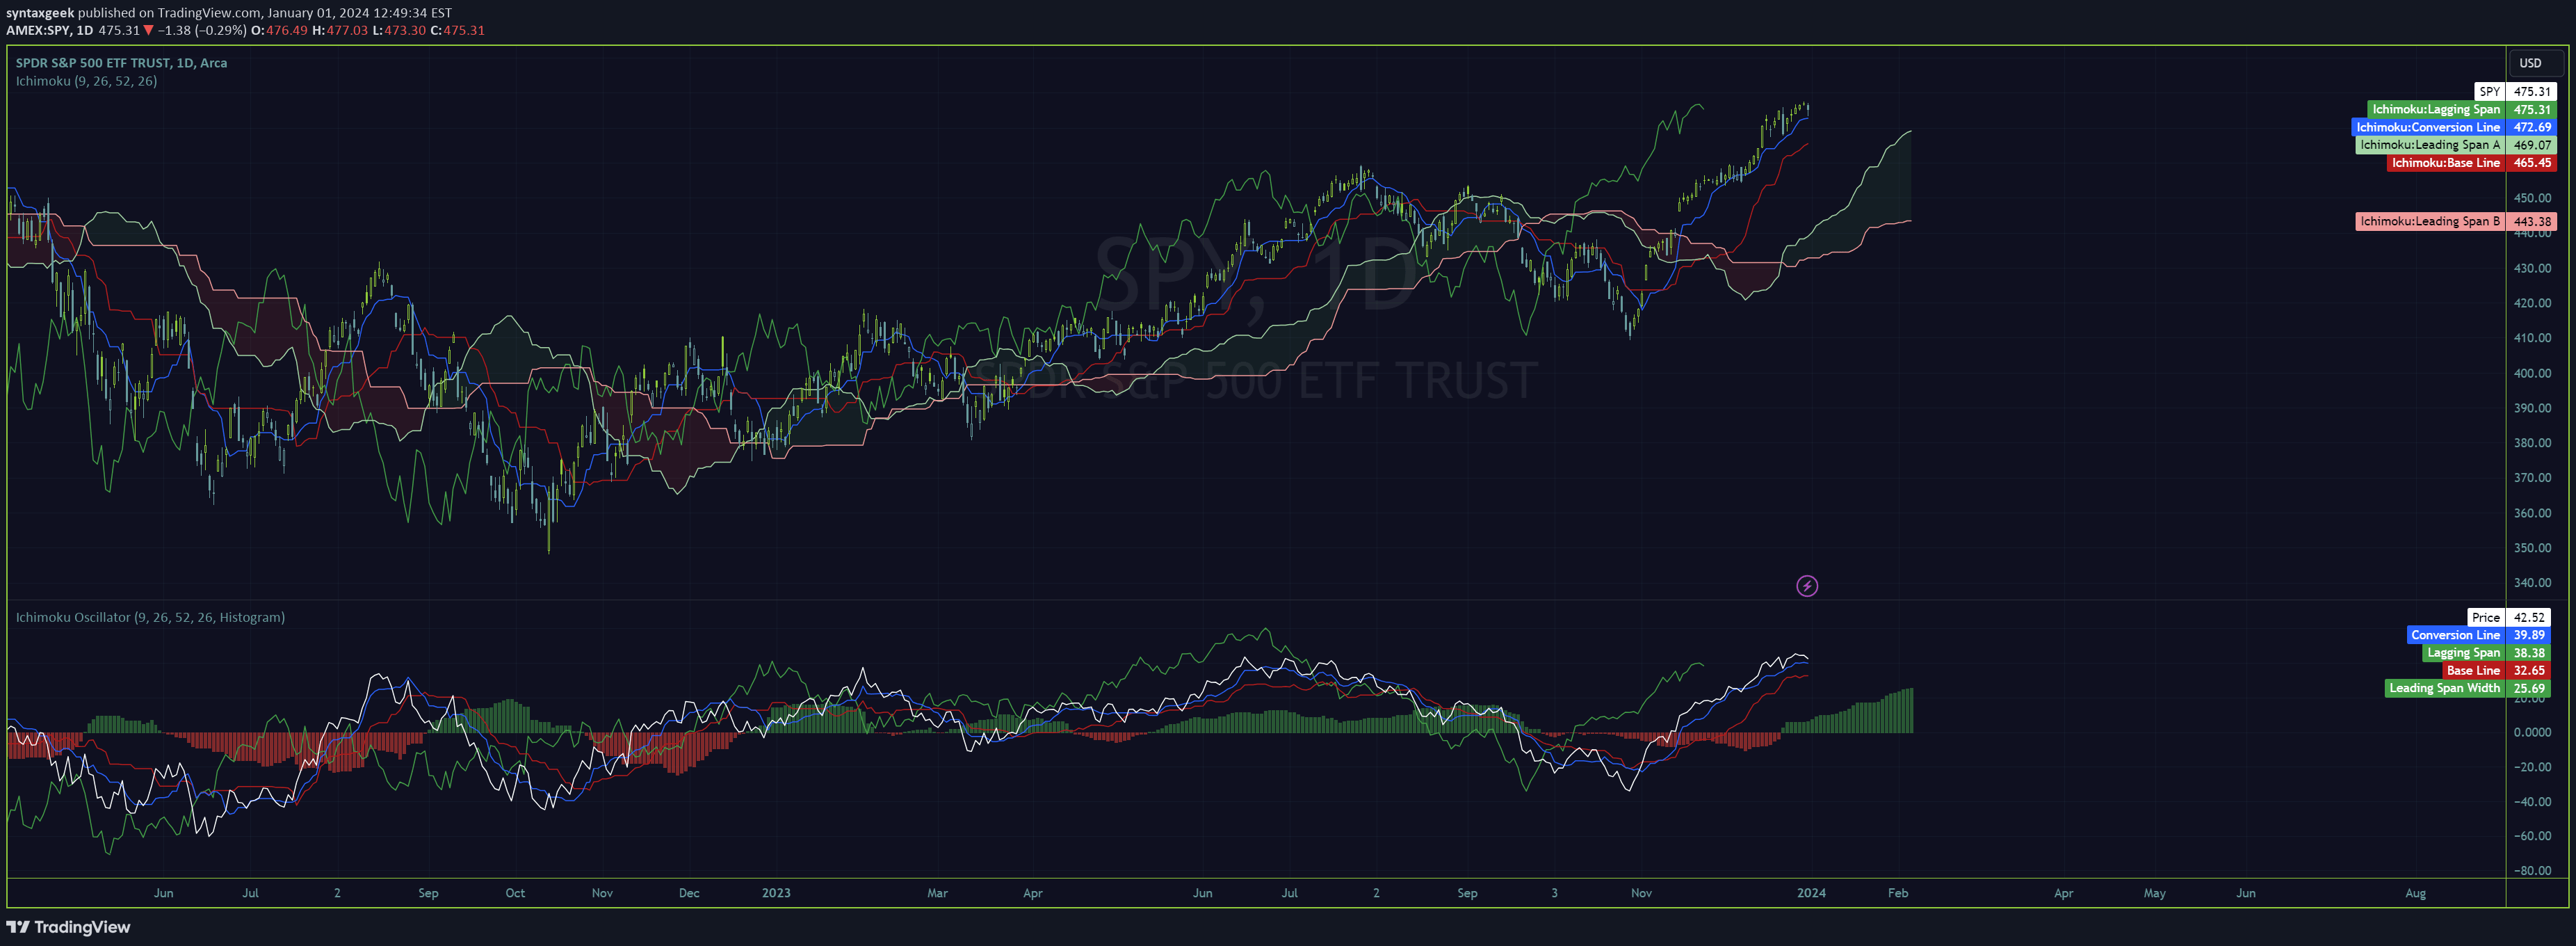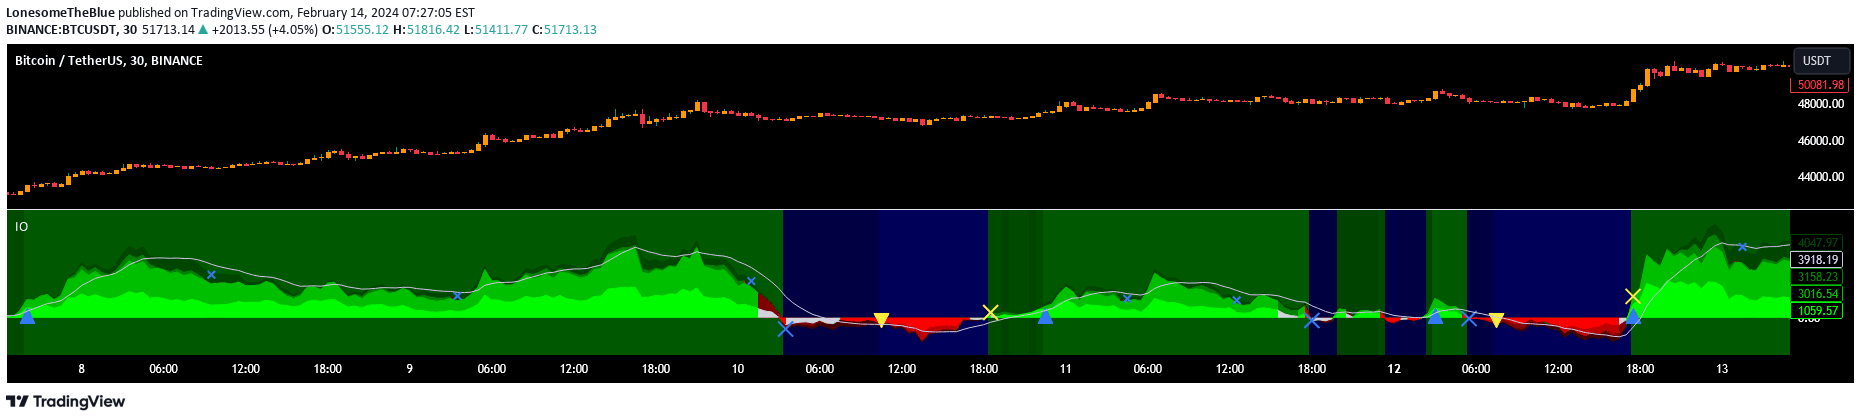
Ichimoku Oscillator is a multi-layered technical analysis tool that evaluates market trends using Ichimoku Cloud features, providing insights into potential entry and exit points.
Explore complementary indicator rolesHow it works
The Ichimoku Oscillator creates four distinct layers to analyze market conditions. The first layer measures the distance between closing price and cloud. The second layer examines the relationship between Lagging Span and Cloud. The third layer compares Conversion and Base lines.
The fourth layer tracks the distance between Lead lines. By evaluating these layers against the main trend, traders can identify potential trading opportunities. The indicator uses multiple Ichimoku Cloud components to generate comprehensive market analysis signals
Why it may be useful
The Ichimoku Oscillator provides a comprehensive approach to market analysis by integrating multiple technical indicators into a single tool. It helps traders understand market trends, identify potential entry and exit points, and manage risk more effectively.
The multiple layers offer a nuanced view of market dynamics, reducing the likelihood of false signals. Traders can customize alert messages and utilize additional features like ATR for trend protection. The indicator helps traders make more informed decisions by providing a holistic view of market conditions
When to explore it
The Ichimoku Oscillator works best in trending markets with clear directional movement. It is particularly useful for traders seeking a comprehensive market analysis tool that goes beyond traditional single-indicator approaches.
The indicator is most effective when all four layers align with the main trend, signaling potential entry points. Traders should use it in conjunction with other technical analysis tools for confirmation. It is especially valuable for swing and day traders who want a multi-dimensional view of market conditions
Keep exploring
What we’ve verified
Access, alerts and repainting behaviour have not been independently verified for this indicator. Check the creator’s current publication and settings.
General descriptions and classifications are recovered research. Verified details above identify the specific checks we have completed. Check the creator’s current publication for later changes.