Order Blocks & Breaker Blocks [LuxAlgo]
Order Blocks & Breaker Blocks indicator identifies key price zones where significant trading activity occurred, highlighting potential future trading opportunities based on market structure.
Explore 11,183 indicators. Filter beyond the obvious.
Discover the tools that fit the way you trade.
11,183 tools to explore
Order Blocks & Breaker Blocks indicator identifies key price zones where significant trading activity occurred, highlighting potential future trading opportunities based on market structure.
A multi-indicator divergence script that analyzes divergences across 10 different technical indicators to identify potential trend reversals and price movements.
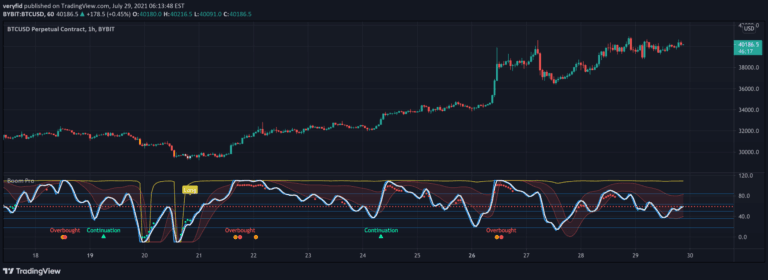
Boom Hunter Pro is an advanced trading indicator using Ehlers Early Onset Trend oscillator to identify potential long entries and short opportunities across different timeframes.
A customizable market session tracker displaying trading hours for Tokyo, London, New York, and Sydney with multiple visualization options and advanced trading insights.
A volume heat map indicator that colors volume bars and candles based on the standard deviation of trading volume from its average. Provides visual insights into volume intensity and potential market significance.
A sophisticated charting tool that analyzes price and volume data to reveal market sentiment, liquidity distribution, and significant trading levels across different market conditions.
A sophisticated technical analysis tool combining LOWESS smoothing and adaptive Gaussian moving average to detect trends, pivot points, and breakouts with enhanced market dynamics visualization.
Ichimoku Oscillator is a multi-layered technical analysis tool that evaluates market trends using Ichimoku Cloud features, providing insights into potential entry and exit points.
A dynamic trendline indicator that tracks market trends across three different timeframes, using swing points and color-coded visualizations to highlight potential trend shifts and price movements.
A unique indicator that compares buyers' demand and sellers' supply volumes to assess market sentiment through a graded faith scale represented by colored histogram staves.
A volume footprint indicator that divides candles into intervals, showing the distribution of trading volume across different price levels within a single candlestick.
A Smart Money Concepts trading indicator that identifies demand and supply zones, highlighting key liquidity levels and price structure changes across multiple timeframes.
Likes, views, and comments are historical TradingView snapshots. They describe attention, not trading performance.