
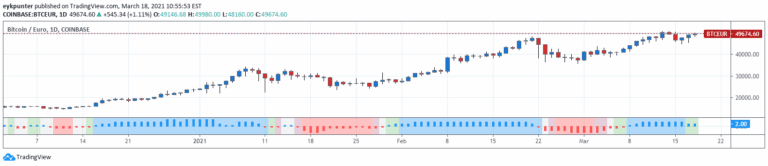
Faith Indicator
A unique indicator that compares buyers' demand and sellers' supply volumes to assess market sentiment through a graded faith scale represented by colored histogram staves.
Explore 11,183 indicators. Filter beyond the obvious.
Discover the tools that fit the way you trade.
11,183 tools to explore
A unique indicator that compares buyers' demand and sellers' supply volumes to assess market sentiment through a graded faith scale represented by colored histogram staves.
KCGmut is a trading indicator that analyzes price momentum by tracking Keltner Channel's Center of Gravity, visualizing market movement through color-coded columns and volume spikes.
Multiple Moving Averages (MMA) is a sophisticated trend analysis tool using exponential moving averages to track and filter weekly price movements across short and long-term groups.
The Donchian Channel Oscillator tracks price movements relative to historical channel extremes, providing insights into market trends, momentum, and potential reversal points.
REVE Cohorts is a volume and range analysis tool that classifies trading volume and price ranges, providing visual signals to help traders understand market dynamics and potential trend changes.
A price direction evaluation tool that assesses consecutive bars or sets of bars to determine market movement trends using a three-value Boolean approach.
A volume-focused indicator that analyzes market trading volume through three calculated lines, providing insights into market activity, focus, and potential price corrections.
Likes, views, and comments are historical TradingView snapshots. They describe attention, not trading performance.