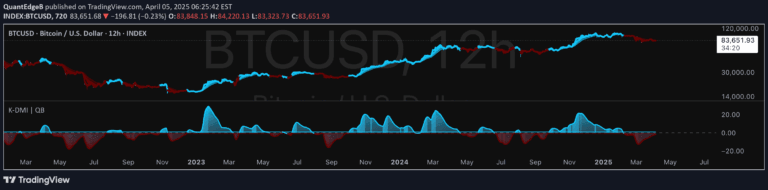
The Donchian Channel Oscillator tracks price movements relative to historical channel extremes, providing insights into market trends, momentum, and potential reversal points.
Explore complementary indicator rolesHow it works
The Donchian Channel Oscillator measures price position within a dynamic channel, transforming price data into a percentage-based oscillator ranging from 0% to 100%. It plots a 'price river' that shows how prices move between the channel's high and low boundaries, with color-coded patches indicating market momentum and directional shifts.
The oscillator uses Fibonacci levels at 23.6% and 76.4% to provide additional context, and includes visual markers for new highs and lows. By smoothing price data and tracking channel movements, it creates a comprehensive view of price behavior and market emotion.
Why it may be useful
The Donchian Channel Oscillator offers traders a multi-dimensional view of market dynamics by translating complex price movements into an easily interpretable visual format. It helps traders understand not just price direction, but the underlying market sentiment and potential trend strength through its nuanced color-coding and positioning.
By revealing market emotions and price positioning relative to historical ranges, this indicator provides traders with insights into potential trend continuations, reversals, and the intensity of market movements. Its ability to highlight subtle shifts in momentum makes it a powerful tool for understanding market psychology.
When to explore it
The Donchian Channel Oscillator is most effective in markets with clear trending characteristics, where price movements exhibit consistent directional momentum. It performs exceptionally well in timeframes ranging from short-term intraday charts to longer-term swing trading scenarios, offering versatile insights across different trading styles.
Traders should utilize this indicator when seeking to confirm trend strength, identify potential reversal points, and gauge market volatility. It is particularly useful during periods of established market trends, where its nuanced tracking of price movements can provide early signals of potential trend exhaustion or continuation.
Keep exploring
What we’ve verified
Access, alerts and repainting behaviour have not been independently verified for this indicator. Check the creator’s current publication and settings.
General descriptions and classifications are recovered research. Verified details above identify the specific checks we have completed. Check the creator’s current publication for later changes.