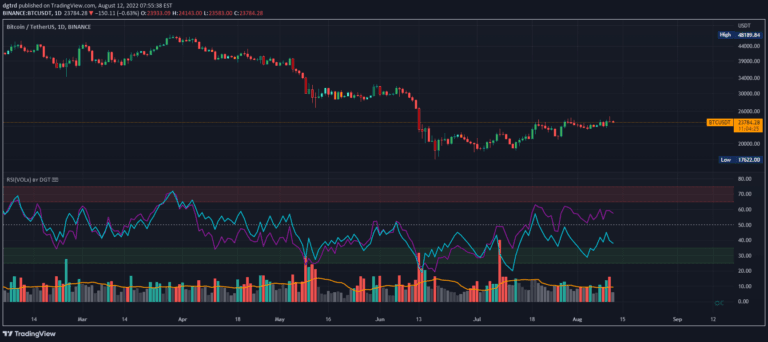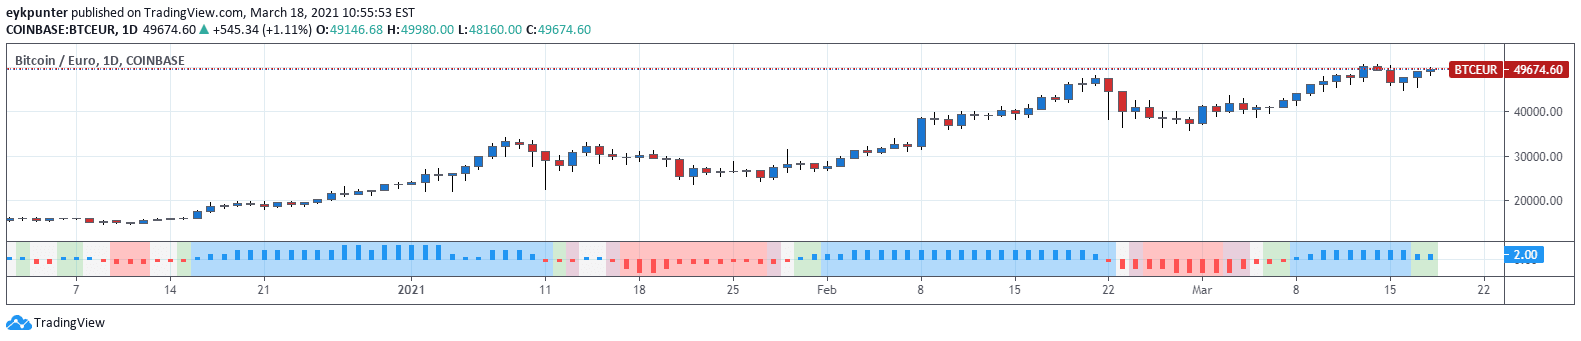
A unique indicator that compares buyers' demand and sellers' supply volumes to assess market sentiment through a graded faith scale represented by colored histogram staves.
Explore complementary indicator rolesHow it works
The Faith Indicator analyzes trading volume by comparing periods of higher highs with increased volume (buyers demand) against periods of lower lows with increased volume (sellers supply).
It calculates the difference between buyers' demand and sellers' supply, then grades the market sentiment on a scale from very high faith (8) to deep distrust (-8). The indicator uses blue upward staves to represent faith and red downward staves to represent distrust, providing a visual representation of market sentiment
Why it may be useful
This indicator offers traders a nuanced view of market psychology by quantifying the balance between buyers and sellers. It helps traders understand underlying market sentiment beyond price movement alone.
By grading faith levels, traders can gain insights into potential trend strength, sustainability, and potential reversals. The combination with the Hull Agreement Indicator's background coloring provides additional context about price movement, allowing for more comprehensive market analysis
When to explore it
The Faith Indicator works best in markets with clear volume data and during periods of significant price movement. It is particularly useful for traders seeking to confirm trend strength, identify potential trend reversals, and understand market sentiment.
Traders should pay special attention to situations where the faith grade contradicts price movement, as these could signal potential market inefficiencies or minority market actions
Keep exploring
What we’ve verified
Access, alerts and repainting behaviour have not been independently verified for this indicator. Check the creator’s current publication and settings.
General descriptions and classifications are recovered research. Verified details above identify the specific checks we have completed. Check the creator’s current publication for later changes.