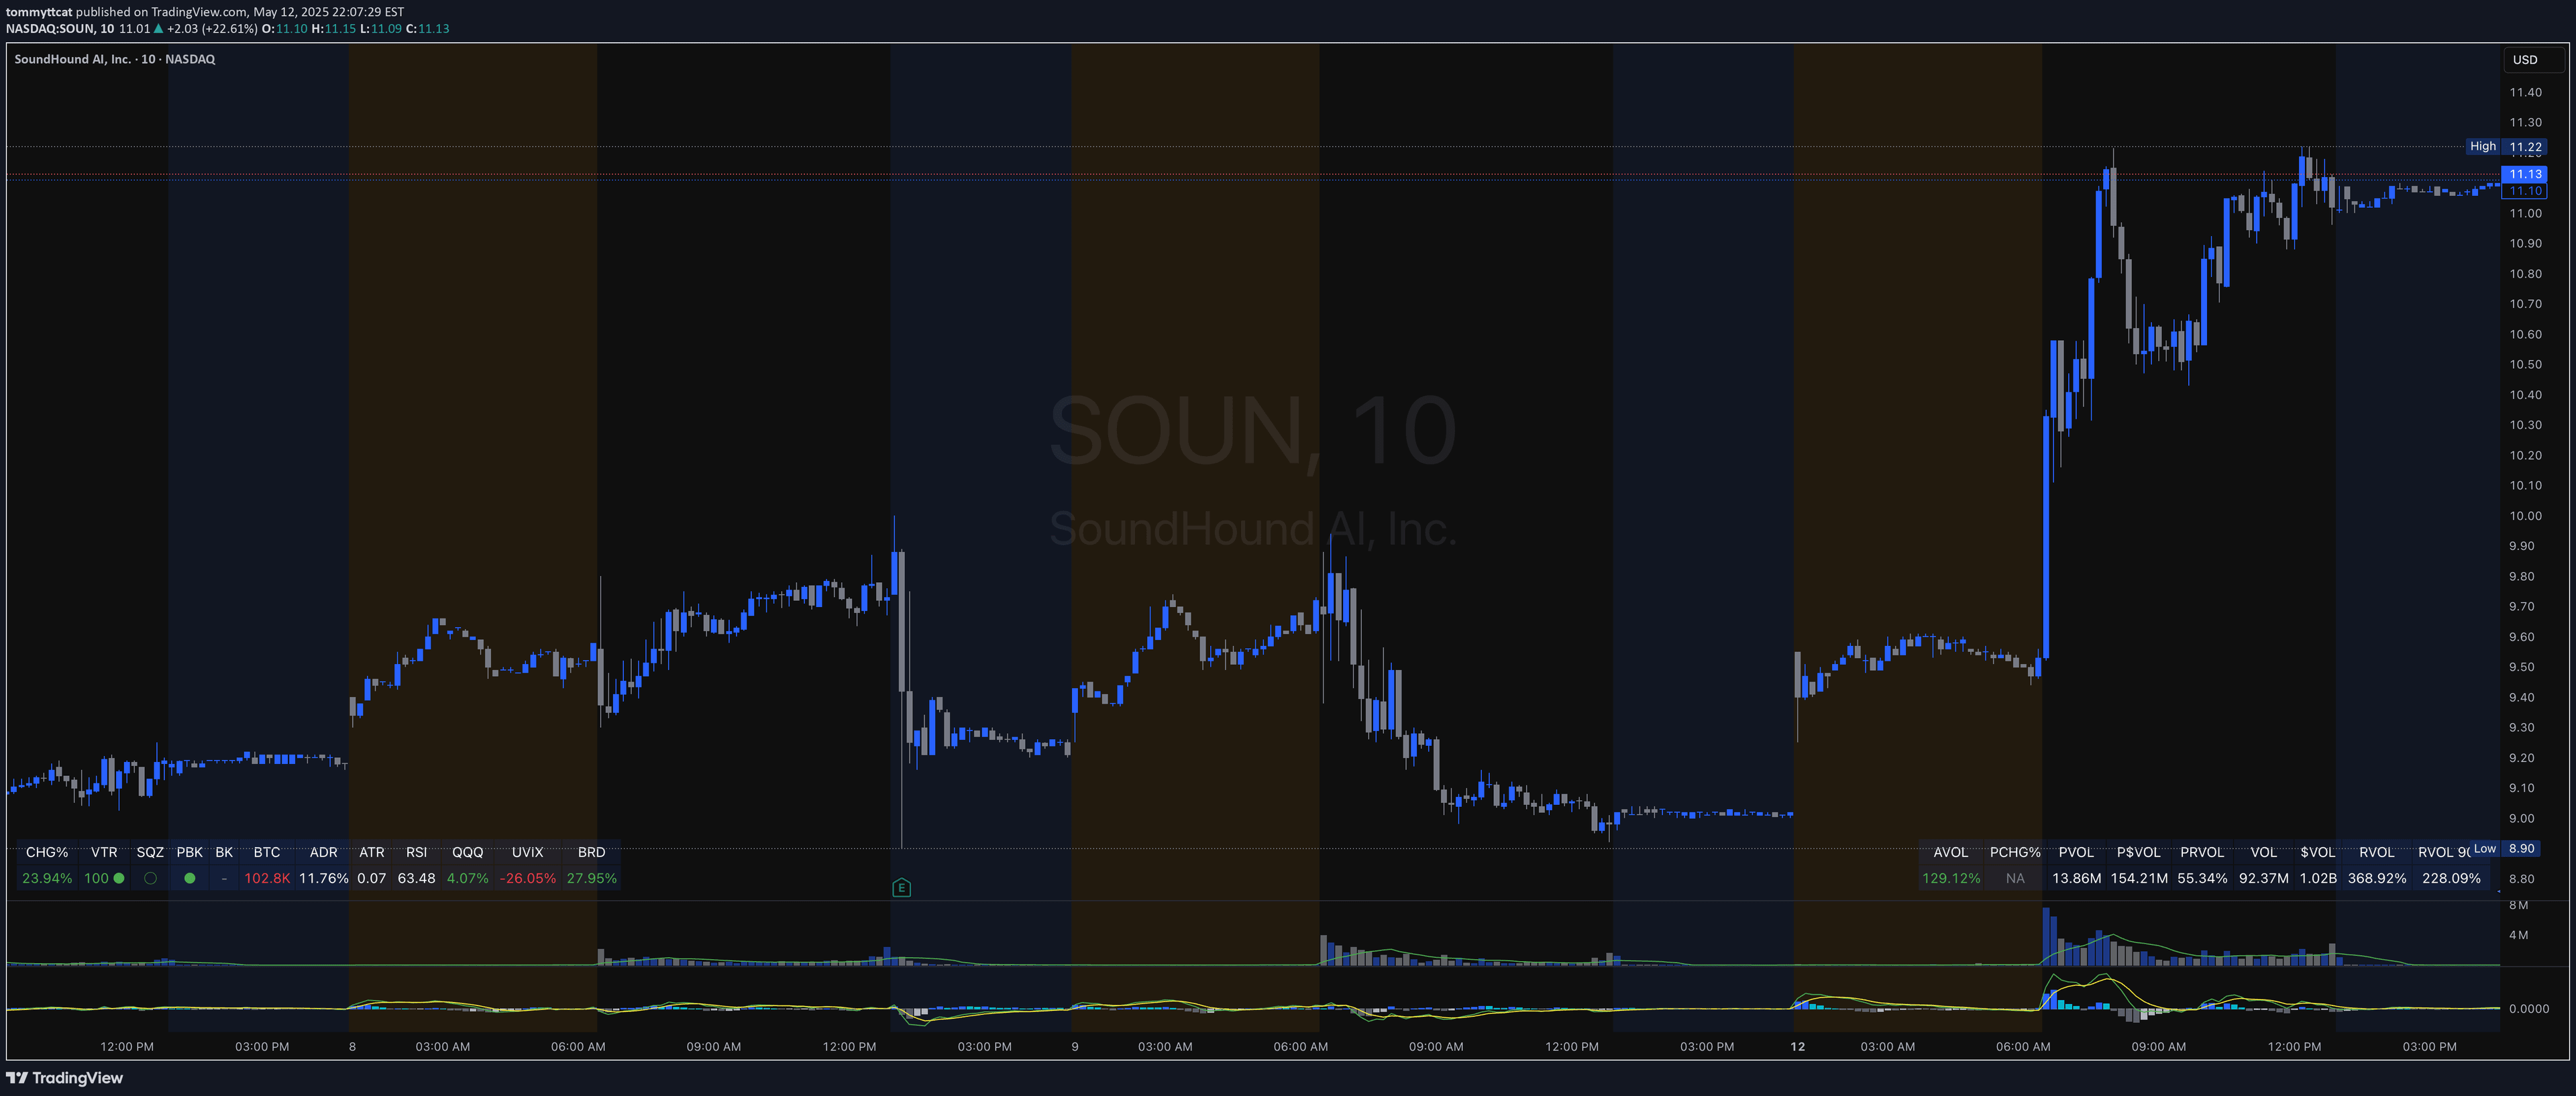
A multi-indicator trading strategy combining MACD, CCI, and Volume Delta to confirm market trends and provide high-probability trade setups with enhanced accuracy.
Explore complementary indicator rolesHow it works
Shavarie's MCV Indicator integrates three key technical analysis components to generate trading signals. The MACD calculates momentum by comparing 12-period and 26-period exponential moving averages, identifying trend strength and potential reversals through line and histogram crossovers.
The CCI measures price deviation from its statistical average, providing overbought and oversold signals when crossing +100 or -100 levels. Volume Delta complements these indicators by measuring real-time buying and selling pressure, confirming trend momentum through actual trading volume analysis.
Why it may be useful
The MCV Indicator eliminates false signals by requiring alignment across multiple technical indicators, significantly reducing the risk of poor trade entries. By combining momentum, trend, and volume analysis, traders gain a more comprehensive view of market dynamics, allowing for more confident and informed trading decisions.
This multi-dimensional approach helps traders avoid emotional trading and provides a systematic method for identifying high-probability trade setups across different market conditions and timeframes.
When to explore it
The MCV Indicator is most effective in trending markets with clear directional movement, particularly in volatile instruments like gold and metal markets. It performs best when used on daily charts for swing trading and 45-minute and 5-minute charts for scalping strategies.
Traders should apply this indicator when seeking confirmation of trend strength, momentum, and volume alignment before entering trades. It is particularly useful during periods of market volatility and when looking to minimize false signals and improve overall trade accuracy.
Keep exploring
What we’ve verified
Access, alerts and repainting behaviour have not been independently verified for this indicator. Check the creator’s current publication and settings.
General descriptions and classifications are recovered research. Verified details above identify the specific checks we have completed. Check the creator’s current publication for later changes.