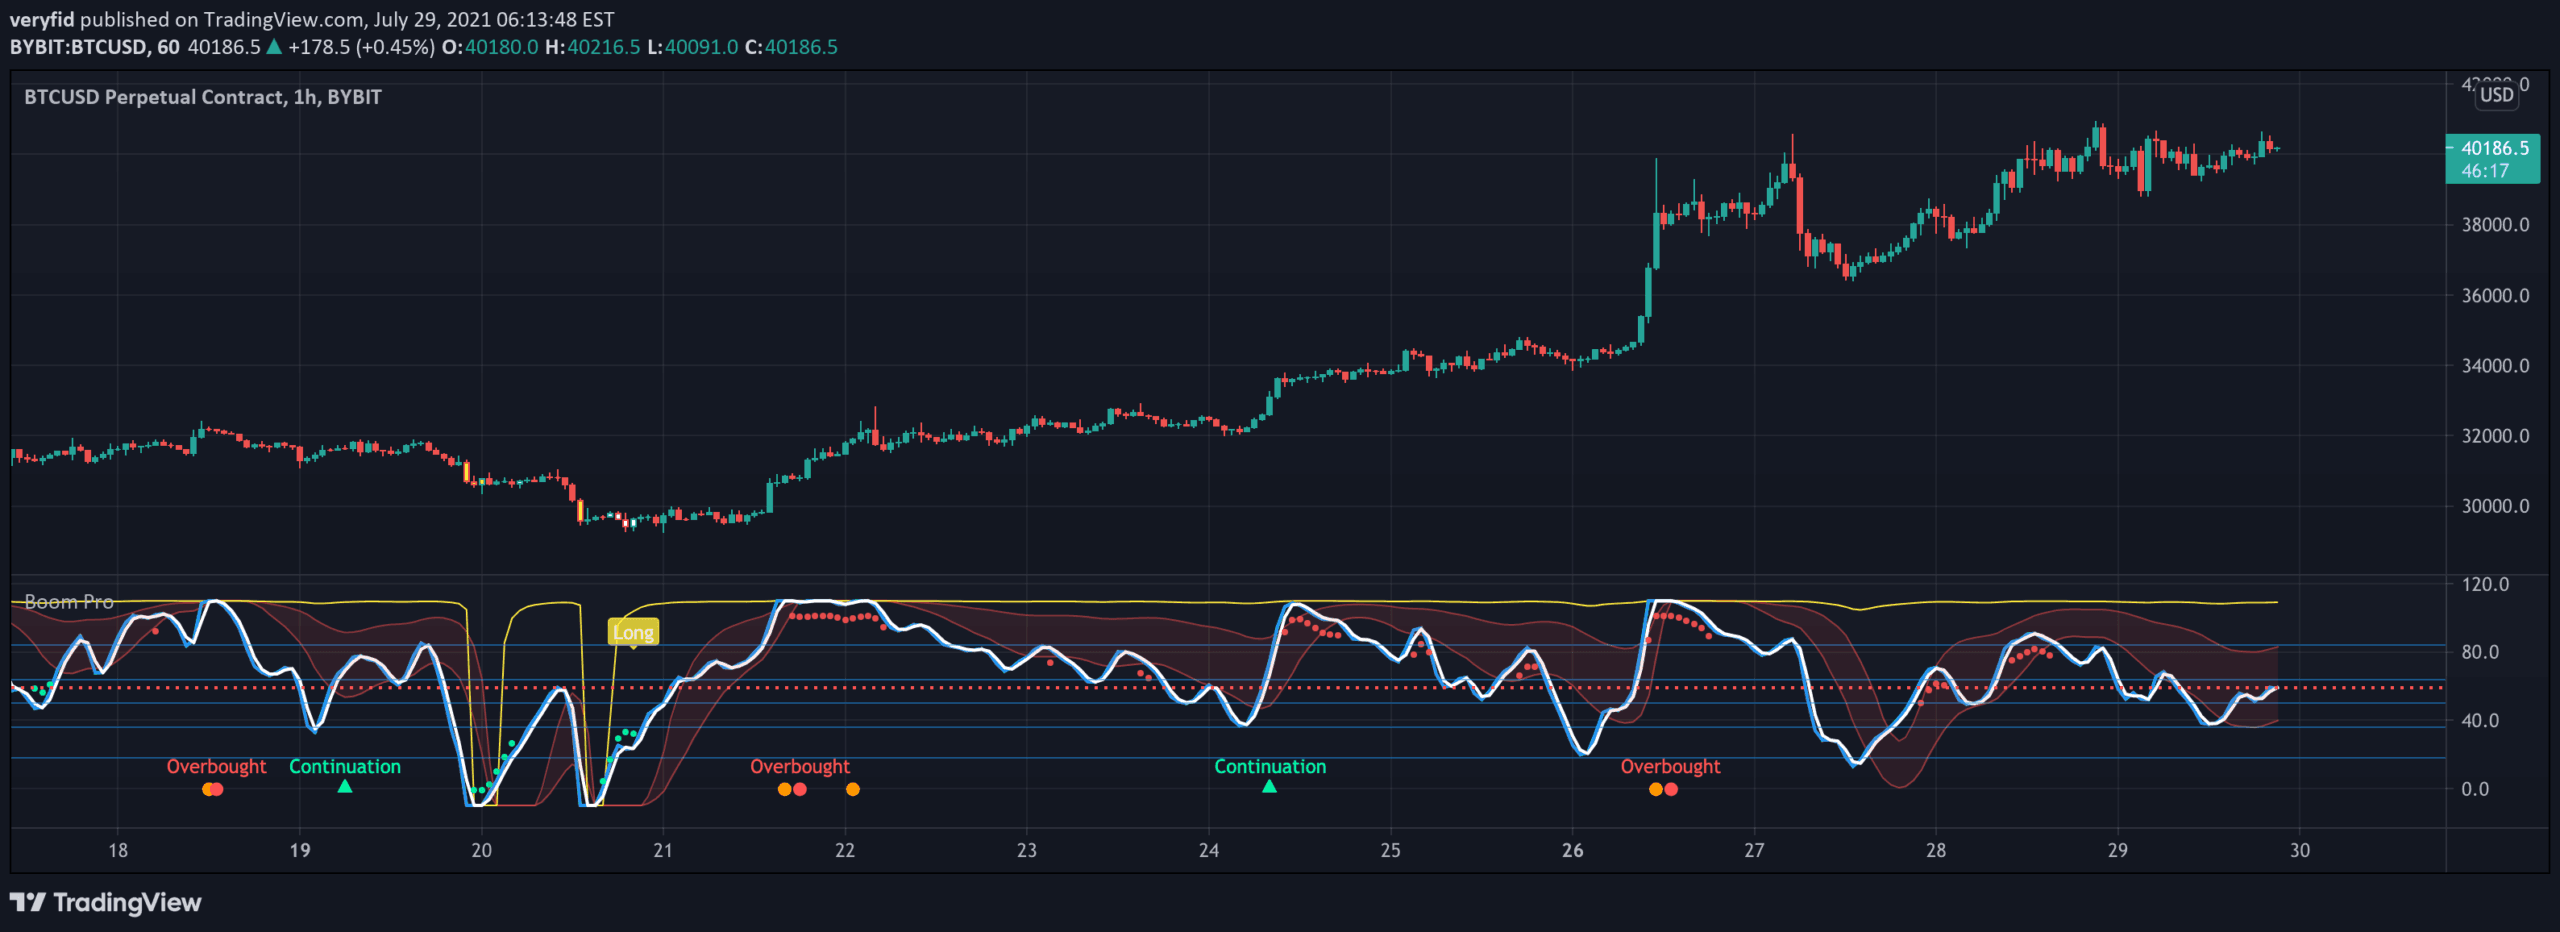
Boom Hunter Pro is an advanced trading indicator using Ehlers Early Onset Trend oscillator to identify potential long entries and short opportunities across different timeframes.
Explore complementary indicator rolesHow it works
The Boom Hunter Pro indicator utilizes the Center of Gravity (COG) oscillator with a sophisticated smoothing filter and roofing filter. It creates a complex analytical tool that tracks price momentum and trend direction. The indicator generates colored bars to signal potential market movements, with purple bars indicating a potential drag or price dump.
It incorporates Fibonacci lines to help traders track price action and identify precise entry and exit points. The oscillator uses advanced mathematical calculations to detect early trend onset and provide traders with actionable insights
Why it may be useful
Boom Hunter Pro provides traders with a comprehensive analytical tool that goes beyond traditional trend indicators. By combining multiple advanced filtering techniques, it offers a more nuanced view of market dynamics.
The indicator helps traders identify potential trend reversals and momentum shifts before they become apparent through standard analysis. Its versatility across different timeframes makes it valuable for various trading styles. The color-coded bar system and Fibonacci integration provide additional layers of visual confirmation for trading decisions
When to explore it
Boom Hunter Pro is most effective when used on 1-hour charts, though it can be adapted to other timeframes. Traders should utilize this indicator during periods of moderate market volatility where trend identification is crucial.
It works best in markets with clear directional movements, such as cryptocurrencies, forex, and major stock indices. The indicator is particularly useful for traders seeking early trend detection and momentum confirmation. Optimal usage includes combining it with other technical analysis tools for comprehensive market assessment
Keep exploring
What we’ve verified
Access, alerts and repainting behaviour have not been independently verified for this indicator. Check the creator’s current publication and settings.
General descriptions and classifications are recovered research. Verified details above identify the specific checks we have completed. Check the creator’s current publication for later changes.