Boom Hunter Pro
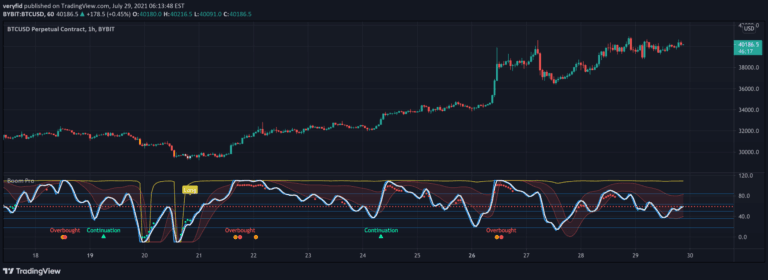
Boom Hunter Pro is an advanced trading indicator using Ehlers Early Onset Trend oscillator to identify potential long entries and short opportunities across different timeframes.
Explore 11,183 indicators. Filter beyond the obvious.
Discover the tools that fit the way you trade.
11,183 tools to explore
Boom Hunter Pro is an advanced trading indicator using Ehlers Early Onset Trend oscillator to identify potential long entries and short opportunities across different timeframes.
A correlation matrix indicator that calculates Pearson correlation coefficients between multiple financial instruments, revealing how different assets' returns move in relation to each other.
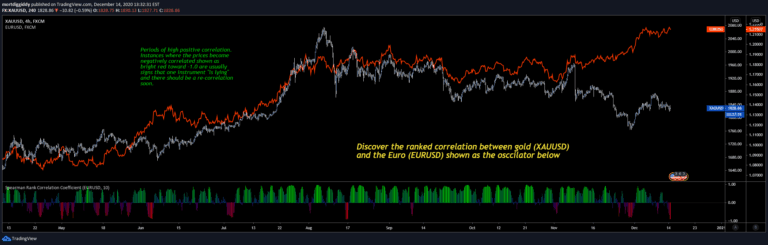
Spearman rank correlation coefficient measures the relationship between two variables by analyzing how they increase or decrease together, revealing potential market synchronization patterns.
A dynamic support and resistance indicator using RSI that identifies key price levels based on overbought and oversold conditions across multiple lookback periods.
A trading strategy focused on detecting perfect engulfing candlestick patterns as potential entry points when they occur near support or resistance levels in the market.
An advanced trading indicator that automatically detects and alerts multiple harmonic chart patterns, providing traders with comprehensive pattern recognition across different market conditions.
A correlation matrix tool that reveals linear relationships between different cryptocurrency trading symbols, helping traders understand market interconnectedness and potential trading opportunities.
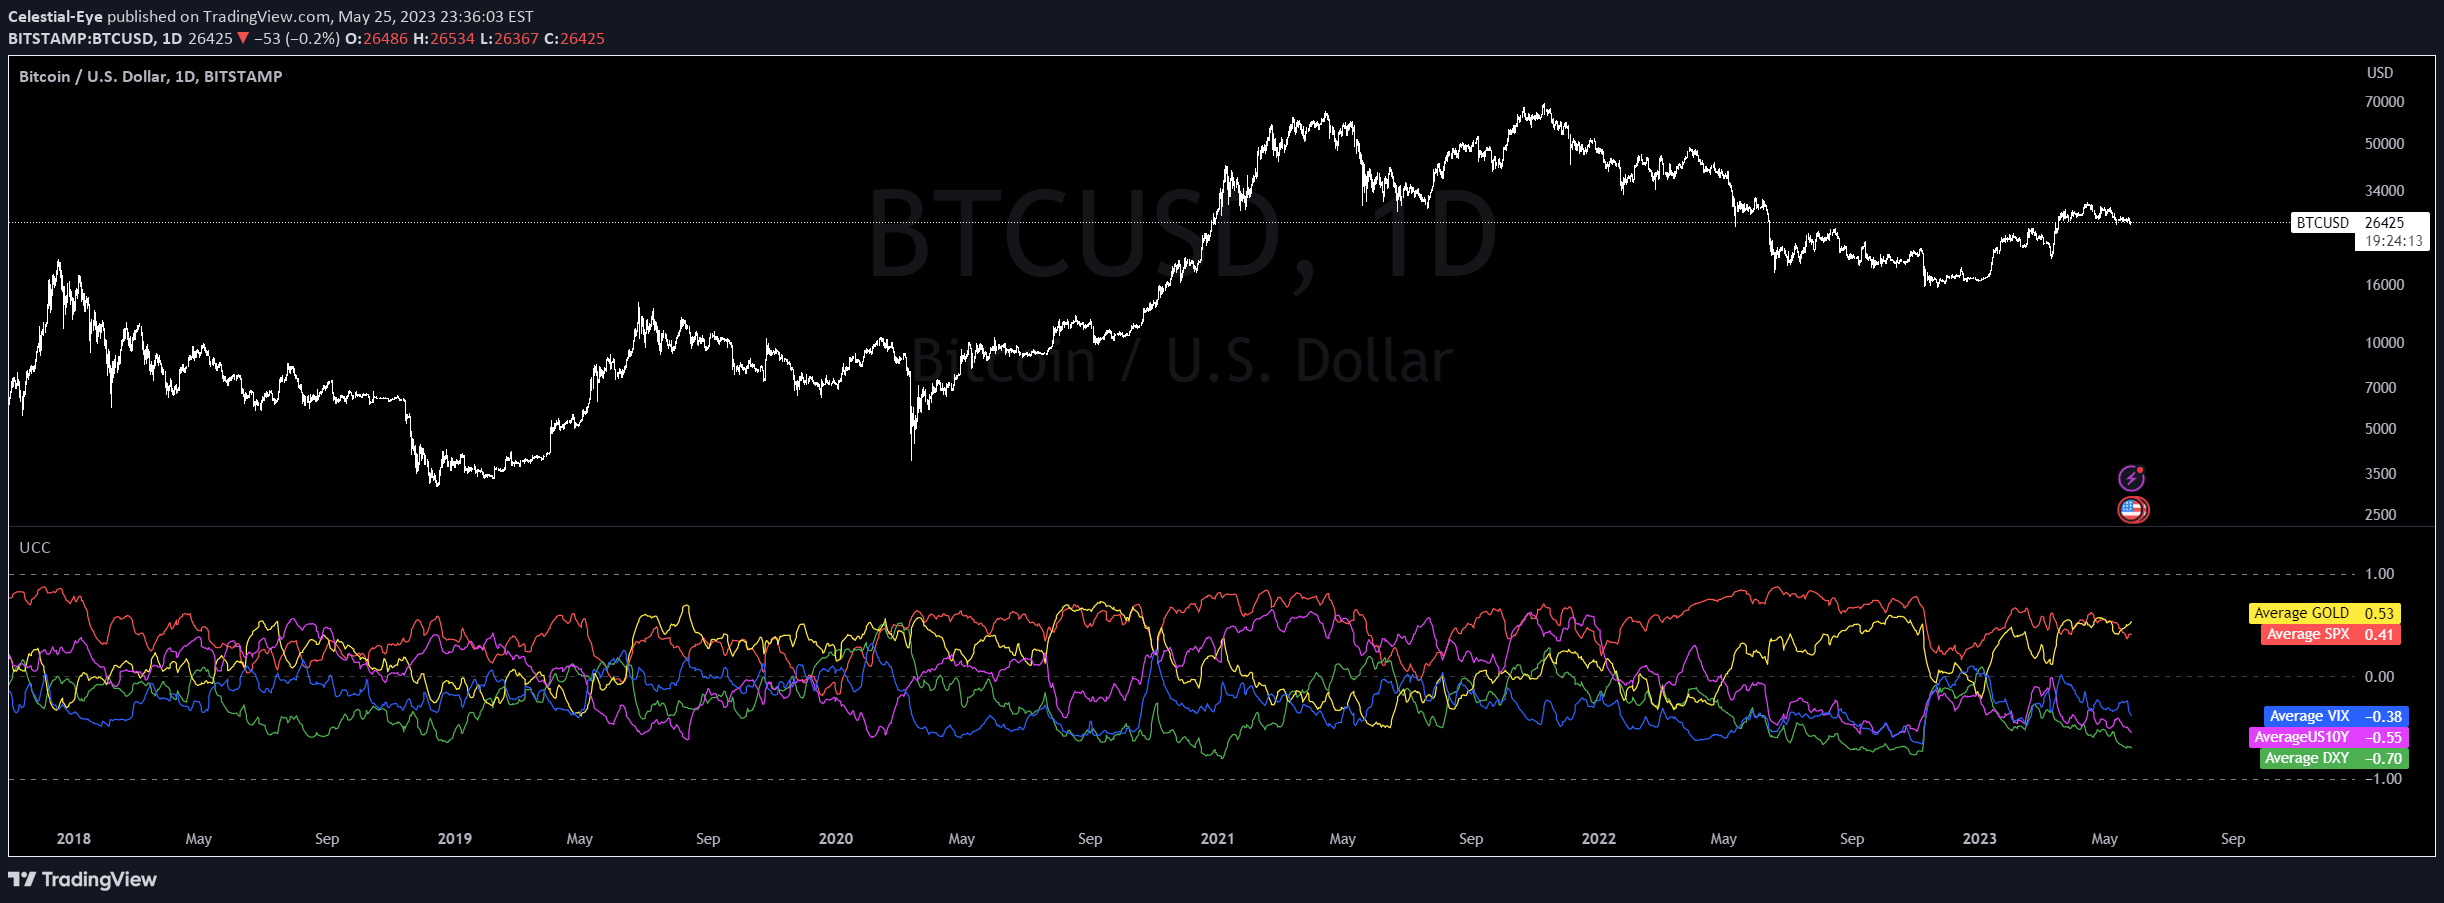
A correlation analysis signal examining relationships between major market indicators like SPX, DXY, Gold, US10Y, and VIX to provide comprehensive market insights.
A trading tool that identifies the best negatively correlated asset for hedging by analyzing price correlations across different cryptocurrencies and determining precise hedge quantities.
A trading indicator that detects perfect order alignment of three moving averages across USDJPY, BTCUSD, and XAUUSD, providing trend direction and visual alerts across multiple timeframes.
Pearson Correlation measures the statistical relationship between two assets' price movements, helping traders understand how different markets interact and potentially move together or inversely.
A powerful buy signal indicating a perfect entry point for traders seeking optimal market positioning and potential profitable trade opportunities.
Likes, views, and comments are historical TradingView snapshots. They describe attention, not trading performance.