
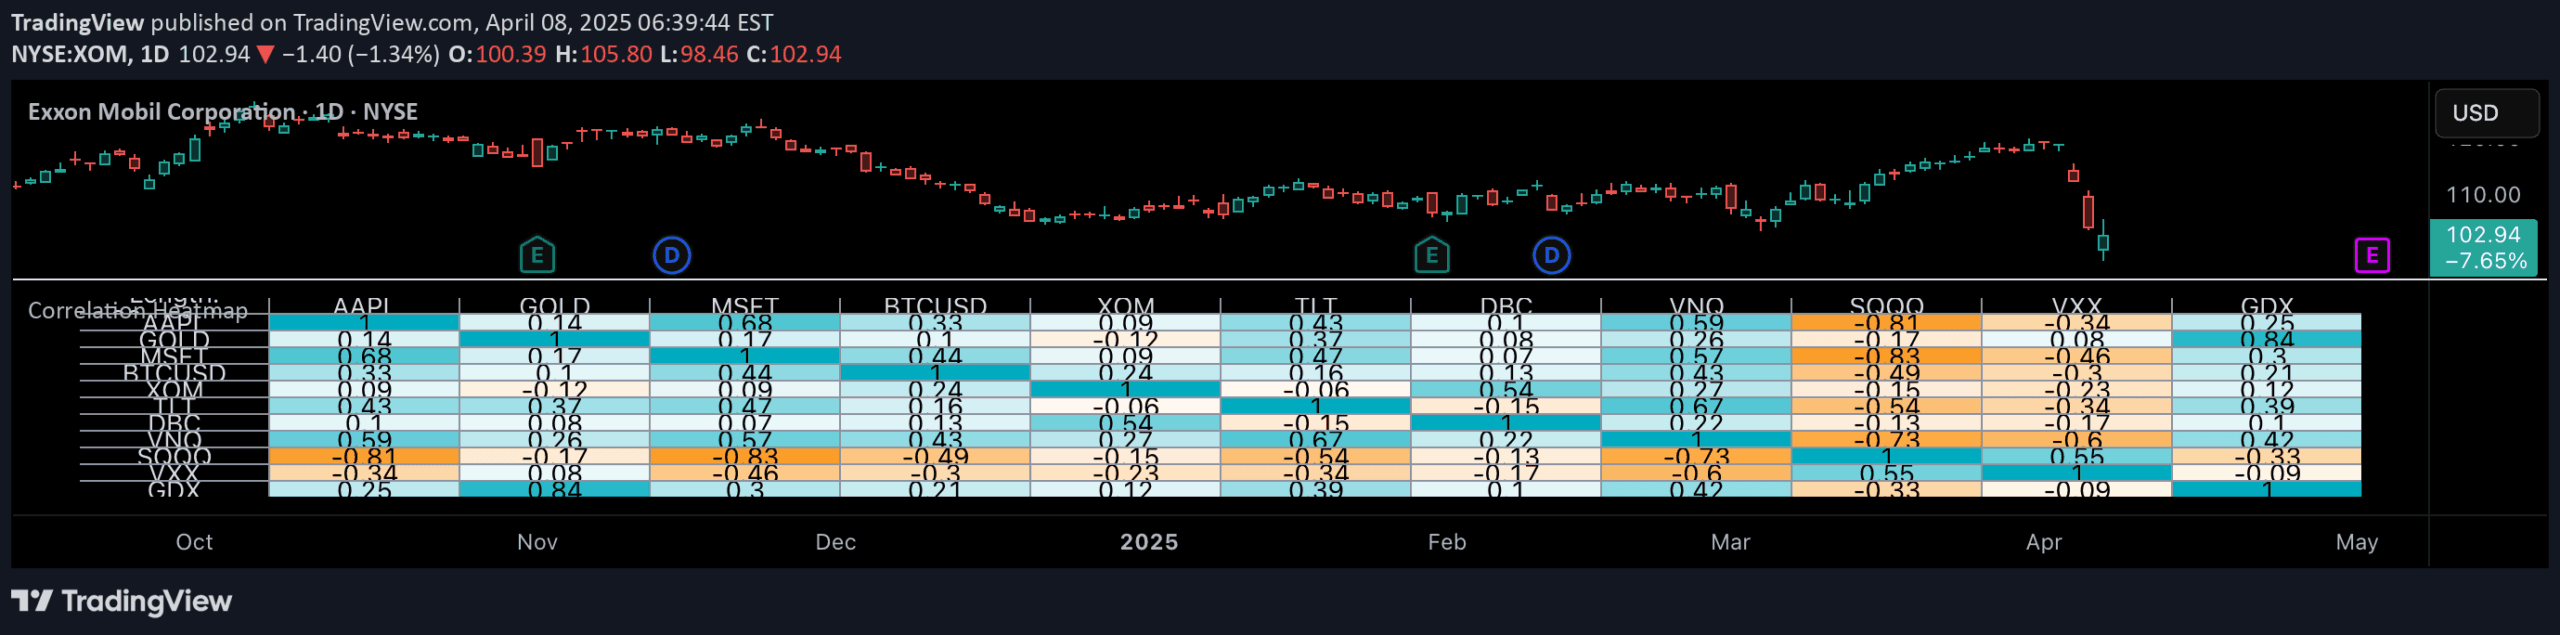
A correlation matrix indicator that calculates Pearson correlation coefficients between multiple financial instruments, revealing how different assets' returns move in relation to each other.
Explore complementary indicator rolesHow it works
The indicator creates a symmetric matrix by calculating Pearson correlation coefficients between user-specified financial instruments. It uses time-aligned weekly or monthly price returns to compute the correlation values.
The process involves requesting aligned prices through spread tickers, calculating arithmetic returns, and comparing how different assets' prices move together. Each cell in the matrix represents the correlation between two specific symbols, with values ranging from -1 (perfect negative correlation) to 1 (perfect positive correlation)
Why it may be useful
Correlation analysis helps traders understand relationships between different financial instruments, which is crucial for portfolio diversification and risk management. By revealing how assets move in relation to each other, traders can identify potential hedging opportunities and reduce unsystematic risk.
The matrix provides insights into potential portfolio construction strategies, helping investors create more balanced investment approaches. Understanding correlations can also help predict potential market behaviors and identify assets that might provide natural portfolio diversification
When to explore it
This indicator works best when analyzing multiple assets across different market sectors or asset classes. It is particularly useful during portfolio construction, asset allocation, and risk management processes. Traders can leverage this tool when seeking to diversify investments, understand market relationships, or identify potential hedging strategies.
The indicator is most effective when used with a diverse range of financial instruments, including stocks, commodities, currencies, and indices. Periodic review of correlations can help traders adapt their strategies to changing market conditions
Keep exploring
What we’ve verified
Access, alerts and repainting behaviour have not been independently verified for this indicator. Check the creator’s current publication and settings.
General descriptions and classifications are recovered research. Verified details above identify the specific checks we have completed. Check the creator’s current publication for later changes.




