Volume / Open Interest "Footprint" - By Leviathan
A footprint bar indicator that visualizes volume or open interest data within the chart's visible range, offering three different heatmap styles to analyze trading activity.
Explore 11,183 indicators. Filter beyond the obvious.
Discover the tools that fit the way you trade.
11,183 tools to explore
A footprint bar indicator that visualizes volume or open interest data within the chart's visible range, offering three different heatmap styles to analyze trading activity.
A volume heat map indicator that colors volume bars and candles based on the standard deviation of trading volume from its average. Provides visual insights into volume intensity and potential market significance.
A trading indicator that calculates volume delta and open interest delta, providing insights into market sentiment and trading activity across different price levels and asset types.
An advanced trading tool that analyzes price ranges by automatically drawing range levels, volume profiles, and various analytical tools to help traders understand market structure and potential price movements.
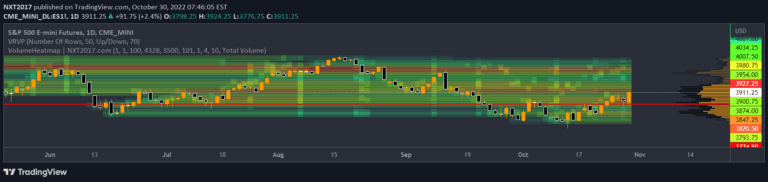
A volume heatmap indicator that identifies price levels with the most trading volume, helping traders find key market activity zones and potential value trading targets.
Advanced volume analysis tool that creates a heatmap and volume profile, providing detailed insights into trading volume, price movements, and market structure across different time frames.
A trading tool that visualizes candle bodies with the highest volume on a lower timeframe, highlighting areas of significant market activity using color-coded heatmaps and interval lines.
An advanced liquidity heatmap that accumulates and tracks resting liquidity levels over time, revealing potential high-impact price zones by aggregating volume across multiple price levels.
An advanced Open Interest indicator that visualizes market positioning by tracking contract changes and aggregating trading activity across different price levels.
An advanced trading indicator that analyzes open interest and price action to visualize market positioning, tracking net long and short positions with multiple analytical tools.
A trading indicator that identifies potential liquidity zones by analyzing volume or open interest to reveal possible liquidation levels and market activity zones.
HTF Candle Volume Thermometer is an advanced volume heatmap tool that visualizes higher timeframe volume distribution, helping traders identify key liquidity zones and price levels.
Likes, views, and comments are historical TradingView snapshots. They describe attention, not trading performance.