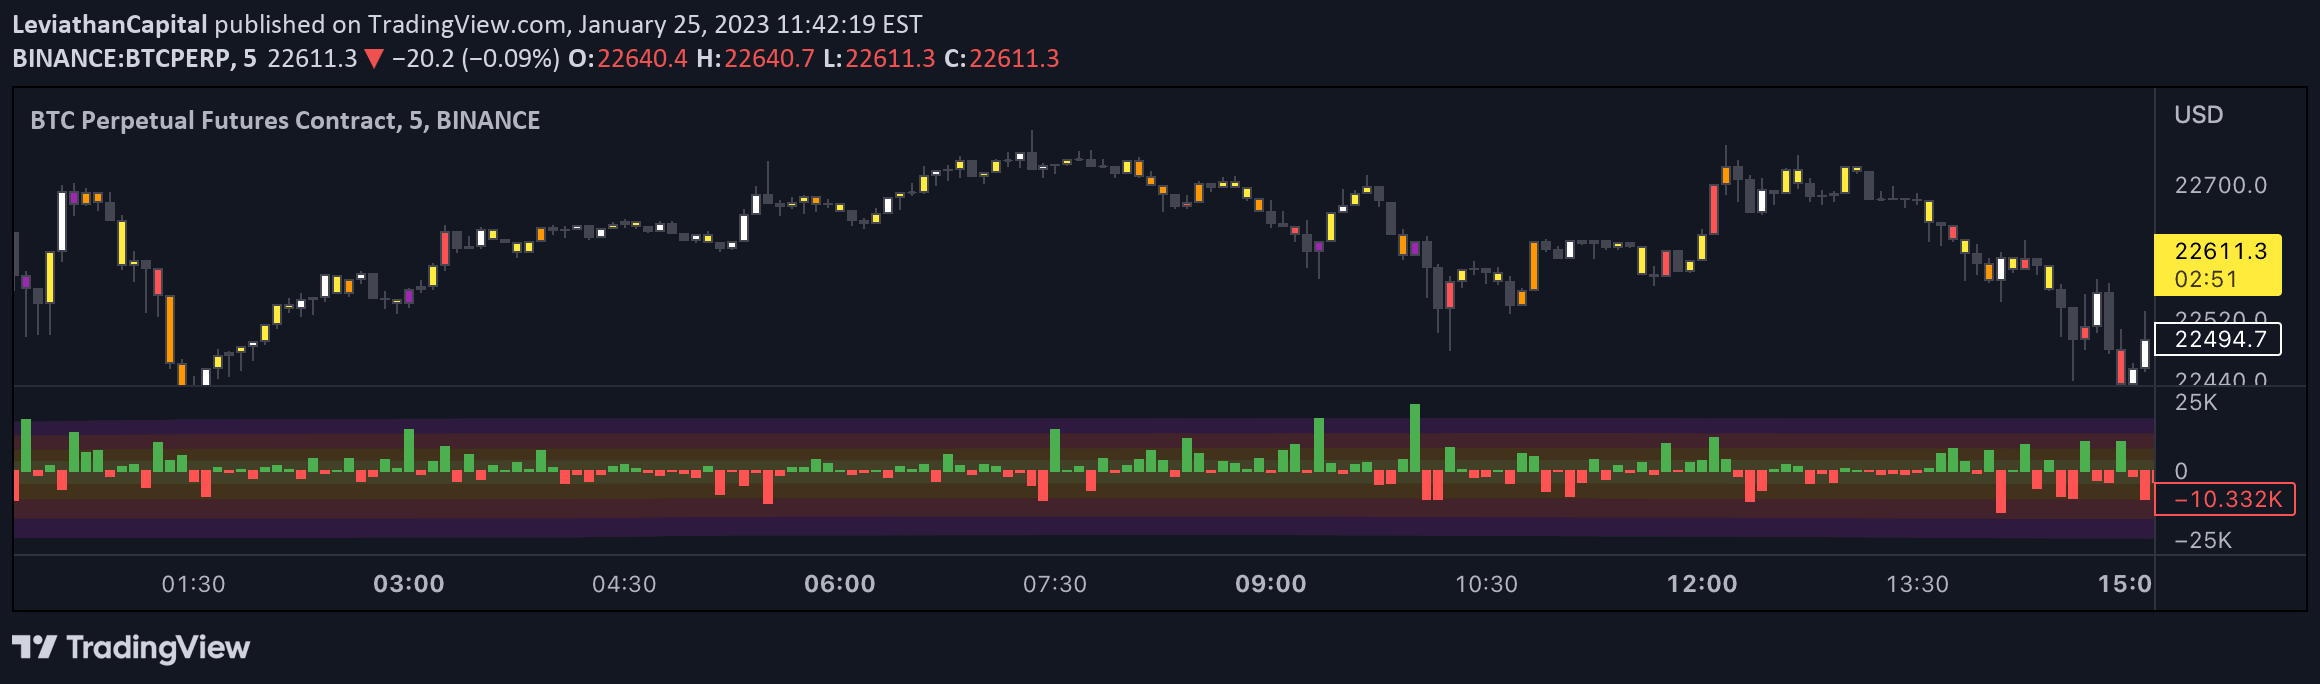
An advanced trading indicator that analyzes open interest and price action to visualize market positioning, tracking net long and short positions with multiple analytical tools.
Explore complementary indicator rolesHow it works
The indicator tracks open interest and price movements to identify how market positions are being entered and exited. It calculates net long and short positions by analyzing changes in open interest combined with price action, using a specific logic that categorizes market movements into four primary scenarios: longs opening, longs closing, shorts opening, and shorts closing.
By tracking these position changes, the script generates cumulative metrics like Net Longs, Net Shorts, Net Delta, and Net Ratio. These metrics are calculated in real-time, allowing traders to understand the underlying market dynamics beyond simple price movement, providing insights into the aggressive or defensive positioning of market participants.
Why it may be useful
Understanding market positioning is crucial for traders seeking to gain a competitive edge in trading decisions. This indicator provides a comprehensive view of market sentiment by revealing how traders are positioning themselves, which can offer predictive insights into potential future price movements and market trends.
By breaking down complex market data into digestible metrics, the indicator helps traders identify potential momentum shifts, assess market aggression, and understand the underlying supply and demand dynamics. The additional tools like divergence finder, volume heatmap, and moving averages further enhance its analytical capabilities, making it a powerful tool for sophisticated market analysis.
When to explore it
This indicator is most effective in markets with significant open interest data, such as futures and derivative markets. It works best in liquid markets where position changes are frequent and meaningful, providing traders with real-time insights into market sentiment and positioning.
Traders should use this indicator during periods of market transition, when tracking shifts in trader sentiment can provide early signals of potential trend changes. It is particularly useful in volatile markets where understanding the underlying positioning can help anticipate potential price movements and validate trading strategies.
Keep exploring
What we’ve verified
Access, alerts and repainting behaviour have not been independently verified for this indicator. Check the creator’s current publication and settings.
General descriptions and classifications are recovered research. Verified details above identify the specific checks we have completed. Check the creator’s current publication for later changes.