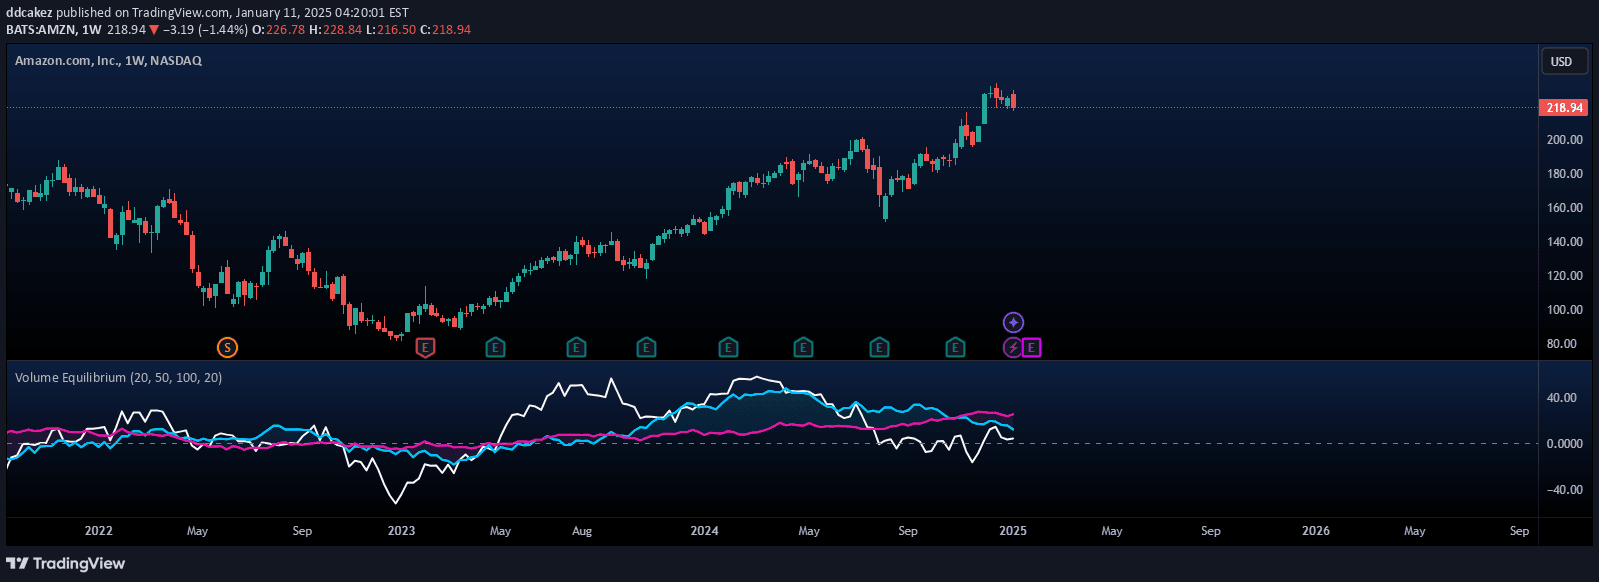
Volume Equilibrium indicator identifies fair-value price points by analyzing trading volume and market dynamics, revealing potential equilibrium zones through directional volume analysis.
Explore complementary indicator rolesHow it works
The Volume Equilibrium signal analyzes trading volume to identify price points where the market perceives a balanced or fair value. It tracks the dynamics of buying and selling volume to pinpoint moments of potential equilibrium, using arrows to indicate the directional movement of volume at these critical price levels.
By examining volume patterns and price interactions, the indicator generates visual representations of market balance. The up and down arrows provide additional context about whether the equilibrium was reached through increasing or decreasing buy volume, offering traders insights into the underlying market sentiment and potential price dynamics.
Why it may be useful
Volume Equilibrium provides traders with a more objective approach to identifying meaningful price levels beyond traditional arbitrary chart lines. By focusing on volume dynamics, traders can gain deeper insights into market sentiment and potential turning points that might be overlooked by conventional technical analysis methods.
This approach offers a nuanced view of market behavior, helping traders understand not just price movement, but the underlying volume dynamics that drive market movements. It bridges the gap between price action and volume analysis, giving traders a more comprehensive tool for making informed trading decisions.
When to explore it
The Volume Equilibrium indicator is most effective in markets with consistent trading volume and clear price action. It works best in liquid markets where volume patterns can provide meaningful insights into market dynamics and potential price equilibrium points.
Traders should use this indicator in conjunction with other technical analysis tools to confirm signals and validate potential trading opportunities. It is particularly useful in identifying potential support and resistance levels, understanding market sentiment, and detecting possible trend reversals based on volume behavior.
Keep exploring
What we’ve verified
Access, alerts and repainting behaviour have not been independently verified for this indicator. Check the creator’s current publication and settings.
General descriptions and classifications are recovered research. Verified details above identify the specific checks we have completed. Check the creator’s current publication for later changes.