
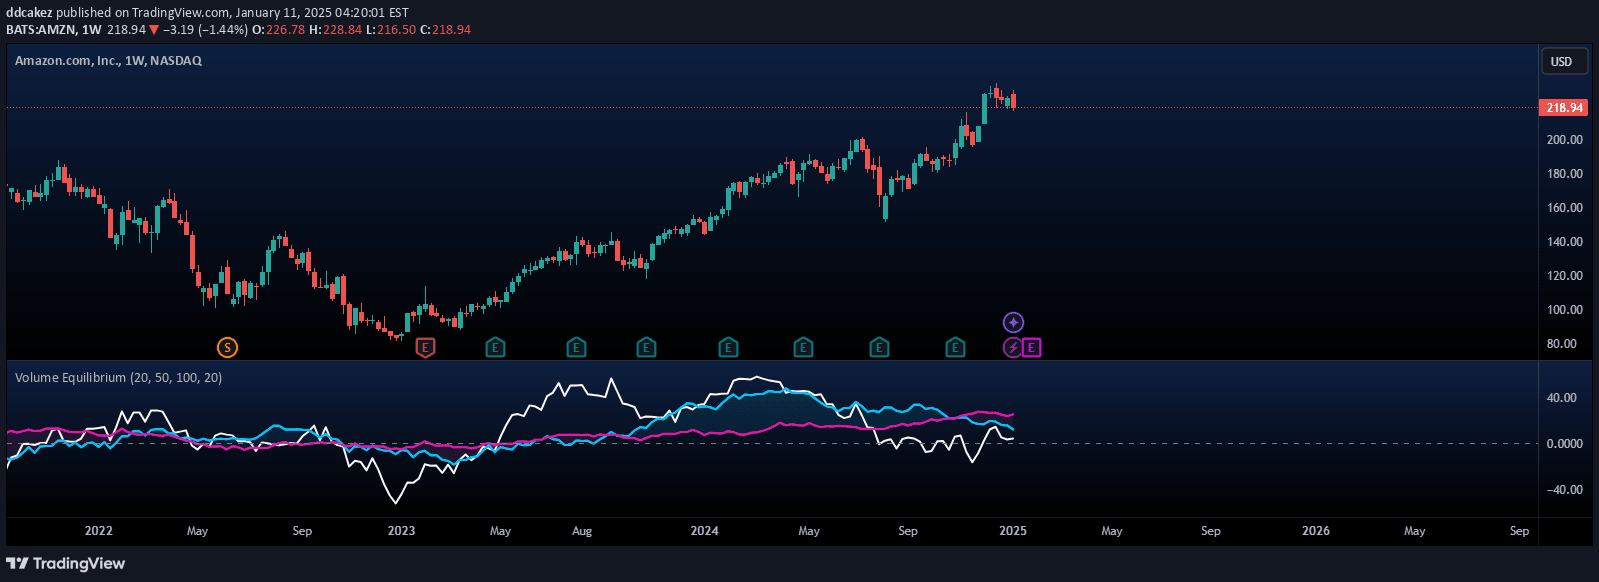
A volume-based indicator that measures buying and selling pressure by comparing cumulative buying and selling volumes across short, mid, and long-term timeframes to assess market sentiment.
Explore complementary indicator rolesHow it works
The Volume Equilibrium indicator calculates buying volume when the close price is higher than the open price and selling volume when the close price is lower. It then computes the Volume Balance by subtracting cumulative selling volume from cumulative buying volume and expressing this as a percentage of total volume.
The indicator provides three different length representations: short, mid, and long-term. By comparing these different timeframes, traders can understand volume dynamics and potential price movements, with the mid and long-term differences highlighting the directional trends in trading volume.
Why it may be useful
Volume Equilibrium offers traders a sophisticated way to understand market sentiment by revealing the underlying buying and selling pressures. By quantifying the balance between bullish and bearish volume, traders can gain insights into potential price trends and market psychology that might not be immediately apparent from price action alone.
The indicator's multi-timeframe approach allows for a more comprehensive market analysis, helping traders identify potential trend reversals, confirm existing trends, and make more informed trading decisions by understanding the strength and direction of market movements.
When to explore it
This indicator works best when used in conjunction with other technical analysis tools, particularly during periods of potential market transitions or when seeking to confirm trend strength. Traders should pay special attention to moments when the Volume Balance approaches zero, signaling potential equilibrium or price consolidation.
The indicator is particularly useful in volatile markets, during significant news events, or when analyzing stocks with complex trading patterns. By providing a nuanced view of volume dynamics across different timeframes, it can help traders identify early signs of trend changes and potential trading opportunities.
Keep exploring
What we’ve verified
Access, alerts and repainting behaviour have not been independently verified for this indicator. Check the creator’s current publication and settings.
General descriptions and classifications are recovered research. Verified details above identify the specific checks we have completed. Check the creator’s current publication for later changes.





