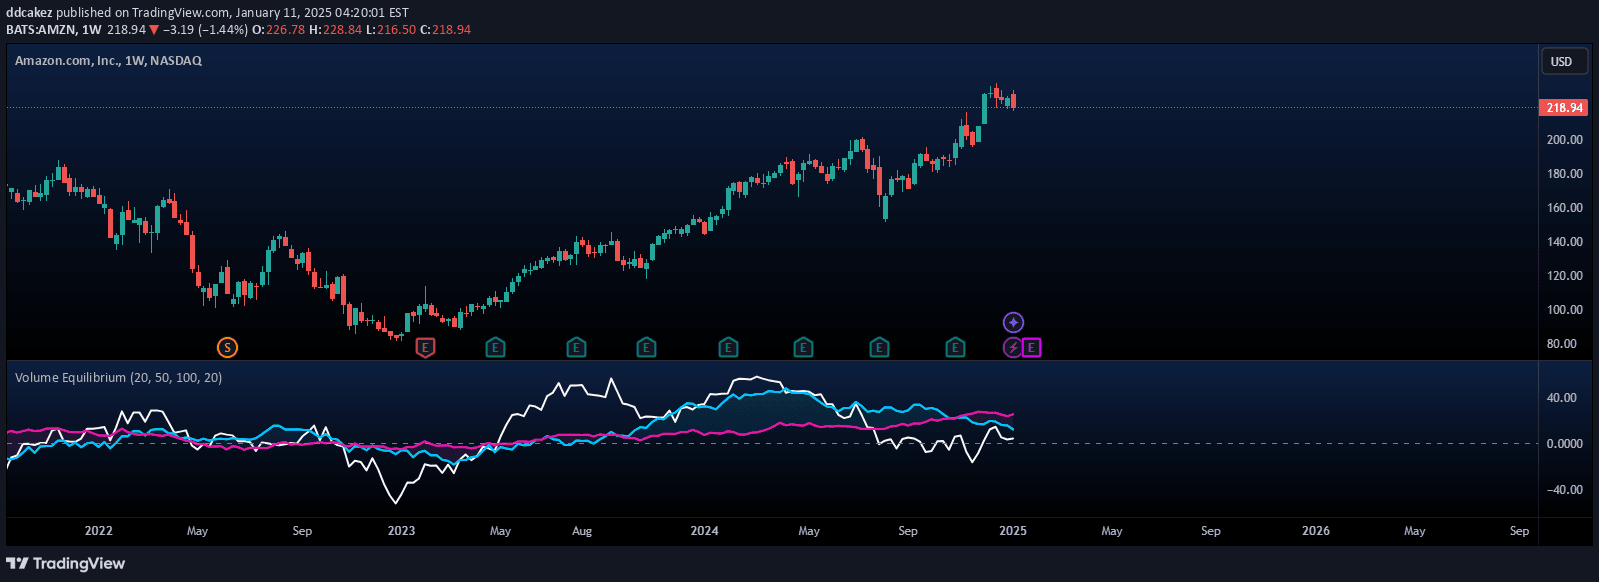
A volume indicator that calculates standard deviation from a long-term weighted moving average to assess trading volume intensity and potential market movements.
Explore complementary indicator rolesHow it works
The indicator begins by establishing a long-term weighted moving average (WMA) of trading volume, which serves as a baseline for measuring typical volume levels. It then calculates the standard deviation from this average, creating multiple deviation bands that help traders understand volume variations from the norm.
As volume deviates from the baseline, the indicator plots progressively intense bar colors corresponding to each standard deviation level. This visual representation allows traders to quickly identify when trading volume significantly differs from historical patterns, potentially signaling important market shifts or momentum changes.
Why it may be useful
Volume indicators are crucial for understanding market dynamics and confirming price movements, providing insights beyond simple price action. By measuring the strength of price trends through volume analysis, traders can make more informed decisions about potential trend continuations or reversals.
The standard deviation approach adds an additional layer of sophistication, enabling traders to quantify and visualize volume variations with greater precision. This method helps identify unusual market activity that might not be apparent through traditional volume charting techniques.
When to explore it
This volume indicator is most effective during periods of market volatility or when seeking to confirm potential trend changes. Traders can use it to validate breakouts, identify potential trend reversals, and assess the strength of price movements through volume analysis.
It works particularly well in short-term trading scenarios like scalping and day trading, where rapid volume fluctuations can provide critical insights. Traders should combine this indicator with other technical analysis tools to enhance its predictive capabilities and reduce false signal risks.
Keep exploring
What we’ve verified
Access, alerts and repainting behaviour have not been independently verified for this indicator. Check the creator’s current publication and settings.
General descriptions and classifications are recovered research. Verified details above identify the specific checks we have completed. Check the creator’s current publication for later changes.