Order Block Finder (Experimental)
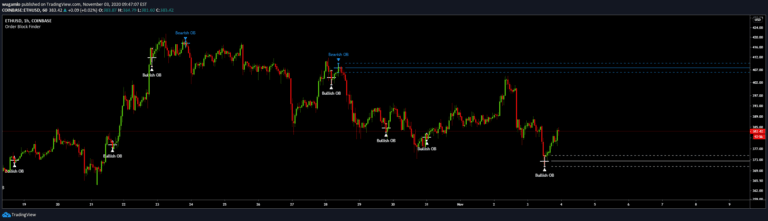
An indicator identifying institutional order blocks by detecting significant price zones where potential trend reversals or continuations might occur based on sequential candle patterns.
Explore 11,183 indicators. Filter beyond the obvious.
Discover the tools that fit the way you trade.
11,183 tools to explore
An indicator identifying institutional order blocks by detecting significant price zones where potential trend reversals or continuations might occur based on sequential candle patterns.
A comprehensive Ichimoku trading tool that combines multiple theories to analyze market trends, cycles, waves, and potential price targets using advanced Japanese technical analysis techniques.
A higher timeframe indicator that identifies and visualizes fair value gaps in price movement, highlighting potential trading opportunities through color-coded background and candle representations.
A volume-based trading tool that identifies market imbalances by analyzing premium and discount zones, calculating delta volume to reveal potential price reversals and trend strength.
An advanced Smart Money Concept indicator that identifies swing high and low zones, helping traders determine premium and discount areas for optimal trade positioning and market structure analysis.
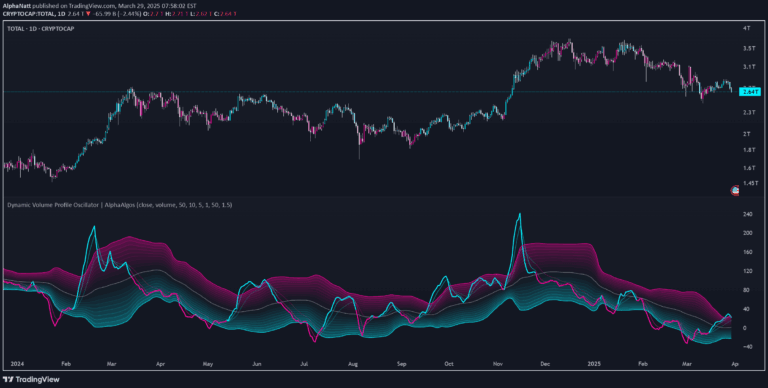
A dynamic volume profile oscillator that analyzes price deviation from volume-weighted equilibrium, providing insights into market momentum and potential trend reversals through adaptive analysis.
A market range indicator that identifies trading session boundaries and potential daily high/low points using predefined and custom time ranges for traders.
A sophisticated indicator that identifies Fair Value Gaps using volume analysis, revealing market inefficiencies and potential price targets with volume-filtered structural insights.
A volume distribution heatmap that visualizes trading volume concentration across different price levels, helping traders identify key market activity zones.
An advanced trading concept that identifies overnight price gaps in futures markets, using specific time frames and standard deviation projections to analyze potential market movements and liquidity zones.
A stock screening tool utilizing multiple technical indicators to identify potential trading opportunities across multiple timeframes, focusing on quick intraday scalping and trade confirmations.
A custom trading indicator that calculates session high, low, and equilibrium levels using Candle Range Theory to identify potential market movements and trading opportunities.
Likes, views, and comments are historical TradingView snapshots. They describe attention, not trading performance.