
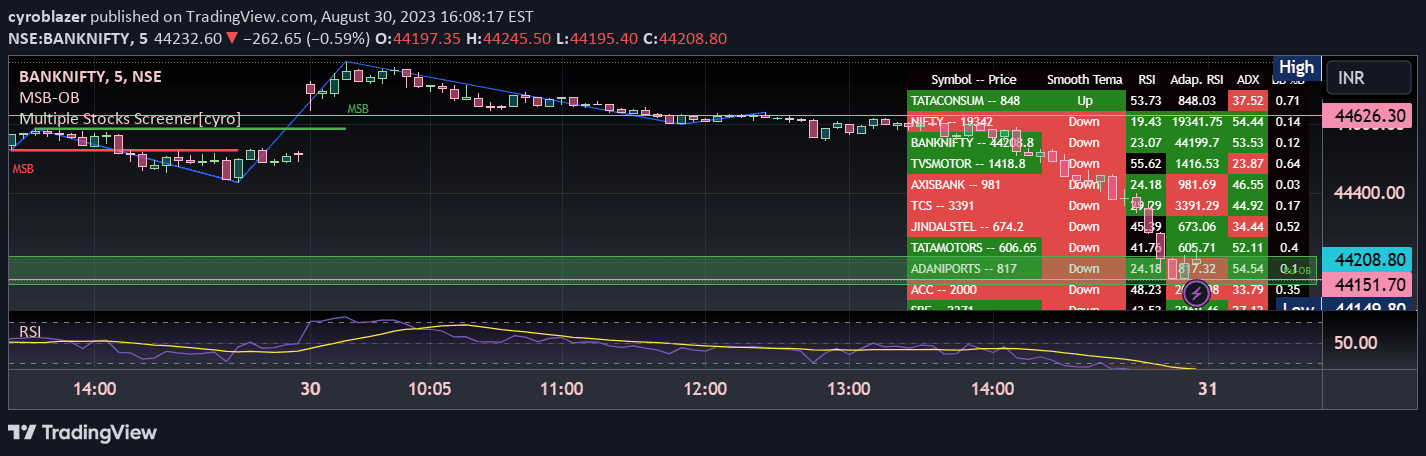
A stock screening tool utilizing multiple technical indicators to identify potential trading opportunities across multiple timeframes, focusing on quick intraday scalping and trade confirmations.
Explore complementary indicator rolesHow it works
The stock screener integrates multiple technical analysis tools like RSI, Supertrend, and ADX to generate trading signals across different timeframes. It analyzes price action using 1, 3, and 5-minute candles, identifying potential entry and exit points through indicator interactions and crossovers.
The system screens up to 40 stocks simultaneously, providing traders with rapid insights into potential trading opportunities. By combining various indicators and examining discount, premium, and equilibrium zones, the screener offers a comprehensive approach to identifying potential market movements.
Why it may be useful
Technical analysis tools help traders make more informed decisions by providing objective, data-driven insights into market behavior and potential price movements. This multi-indicator approach reduces emotional trading and provides a structured method for identifying potential trading opportunities across different market conditions.
By integrating multiple indicators, traders can gain a more holistic view of market dynamics, improving their ability to make strategic entry and exit decisions. The comprehensive screening process allows for quick identification of potential trades, which is crucial in fast-moving market environments.
When to explore it
The stock screener is most effective during periods of moderate to high market volatility, where rapid price movements create multiple trading opportunities. It works best for traders seeking quick, short-term trades with clear entry and exit signals across different timeframes.
Traders should utilize this tool during active market hours, particularly for stocks with high liquidity and consistent price movement. It is especially useful for those focused on intraday scalping and day trading strategies, where quick decision-making and precise signal identification are critical.
Keep exploring
What we’ve verified
Access, alerts and repainting behaviour have not been independently verified for this indicator. Check the creator’s current publication and settings.
General descriptions and classifications are recovered research. Verified details above identify the specific checks we have completed. Check the creator’s current publication for later changes.


