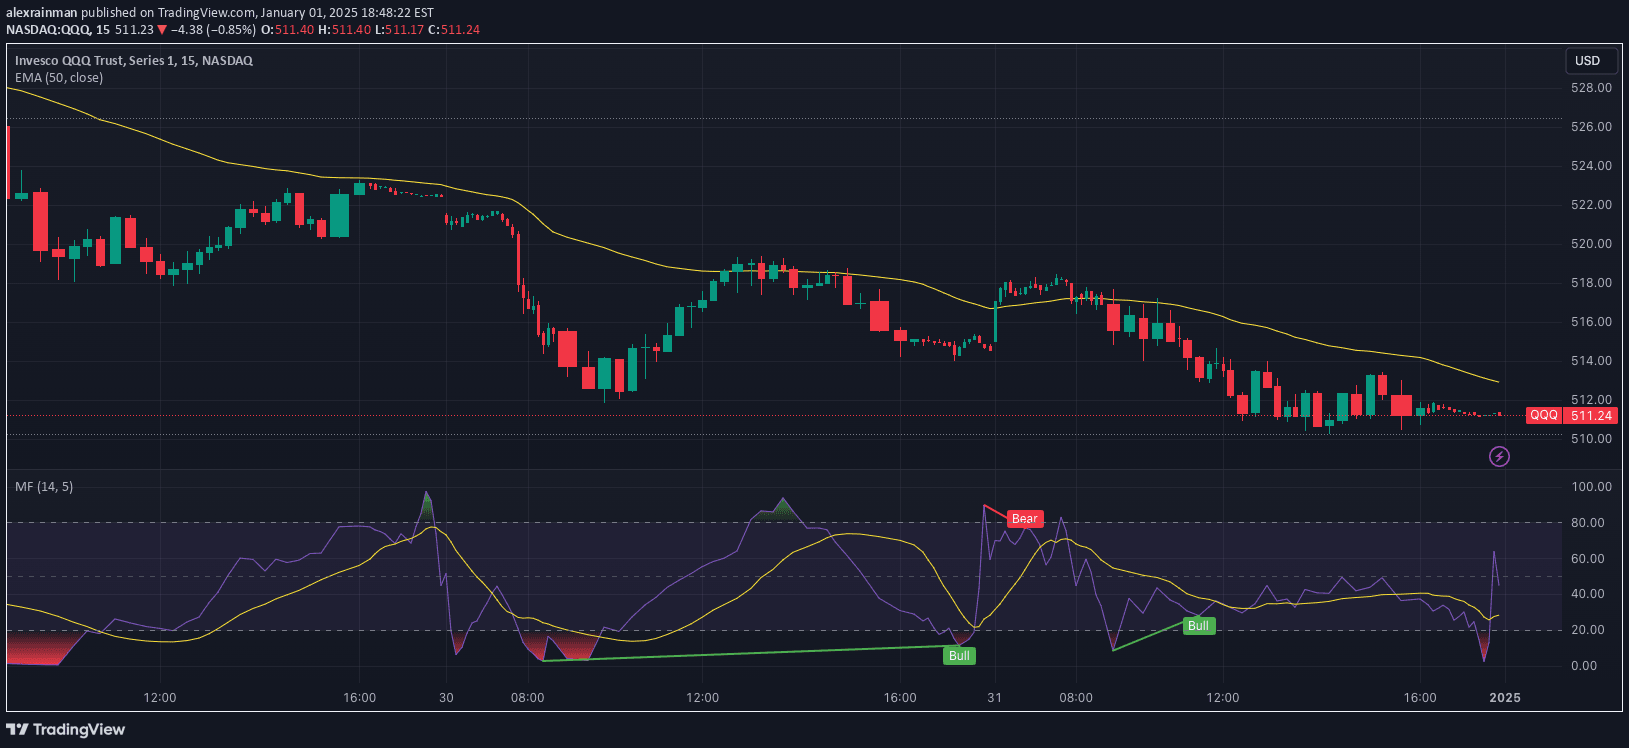
A price change sentiment indicator that normalizes price movements on a 0-100 scale, revealing market momentum and potential overbought or oversold conditions across different timeframes.
Explore complementary indicator rolesHow it works
The Price Change Sentiment Index calculates price movement by comparing the current close price to the previous close, normalized within the day's price range. It transforms this calculation into a 0-100 scale, where 50 represents neutral momentum, values above 75 indicate strong upward movement, and values below 25 suggest strong downward movement.
The indicator applies a smoothing technique using a simple moving average to reduce noise and provide clearer signals. By default, it uses a smoothing period of 3, which can be adjusted to make the indicator more or less responsive to price changes.
Why it may be useful
This indicator provides traders with a quick, visual representation of price momentum that can help identify potential trend shifts and market sentiment. By normalizing price changes, it offers a standardized way to assess market movement across different securities and timeframes, making it easier to compare and interpret market dynamics.
The ability to highlight overbought and oversold conditions helps traders make more informed decisions about potential entry and exit points. By combining this indicator with other technical analysis tools, traders can develop more robust trading strategies and improve their market timing.
When to explore it
The Price Change Sentiment Index is most effective when used in conjunction with other technical analysis tools, providing additional confirmation of potential market movements. It works well across various timeframes, from short-term scalping to longer-term swing trading, making it a versatile tool for different trading styles.
Traders should pay special attention to the indicator when price approaches extreme levels (above 75 or below 25), as these might signal potential trend reversals or continuation. Adjusting the smoothing period can help optimize the indicator's sensitivity to match specific trading strategies and market conditions.
Keep exploring
What we’ve verified
Access, alerts and repainting behaviour have not been independently verified for this indicator. Check the creator’s current publication and settings.
General descriptions and classifications are recovered research. Verified details above identify the specific checks we have completed. Check the creator’s current publication for later changes.