Linear Regression Oscillator [ChartPrime]
A custom indicator using linear regression to analyze closing prices, helping traders identify market trends, mean reversion, and potential overbought or oversold conditions across different timeframes.
Explore 11,183 indicators. Filter beyond the obvious.
Discover the tools that fit the way you trade.
11,183 tools to explore
A custom indicator using linear regression to analyze closing prices, helping traders identify market trends, mean reversion, and potential overbought or oversold conditions across different timeframes.
A trading script combining Exponential Moving Averages (EMAs) and Stochastic RSI to identify market trends, momentum shifts, and potential entry or exit points for traders.
A trading screener that identifies potential overbought or oversold market conditions across multiple symbols using a Mean Reversion Channel. Helps traders quickly scan assets for trading opportunities.
Fair value bands assess price behavior by tracking deviations from a mean basis, helping traders identify normal and abnormal price movements through dynamic statistical bands.
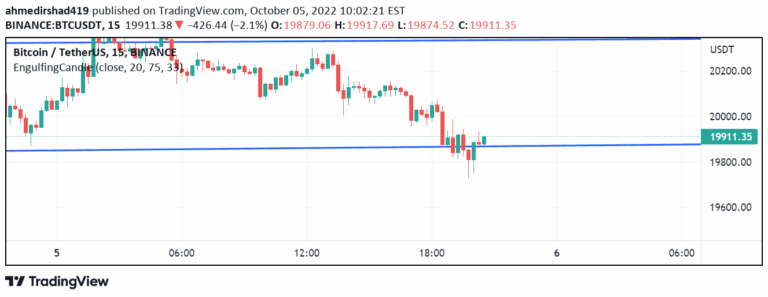
A trading signal combining RSI momentum indicator with candlestick engulfing patterns to identify potential trend reversals and generate buy or sell signals based on overbought and oversold conditions.
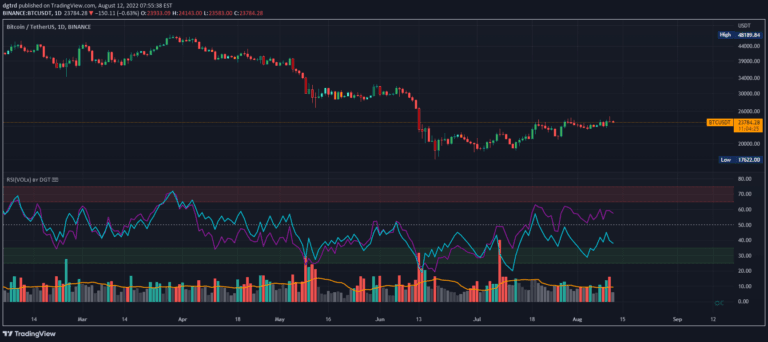
RSI is a momentum oscillator measuring price movement speed, analyzing price changes and volume to identify potential trend reversals and market conditions.
A machine learning-enhanced momentum oscillator that analyzes market trends using weighted moving averages and k-Nearest Neighbors algorithm for dynamic and adaptive momentum prediction.
Parabolic RSI combines Parabolic SAR with Relative Strength Index to identify momentum shifts and potential trend reversals using a unique diamond-based signal system.
RSI Primed combines candlestick visualization techniques with RSI to provide advanced market trend analysis and momentum insights across multiple charting modes.
The Relative Trend Index (RTI) is an advanced technical indicator that measures trend strength by analyzing price positioning within its recent range, offering more adaptive insights than traditional momentum tools.
Advanced trading indicator that detects potential market reversals using price action analysis, volume confirmation, and a dynamic moving average to identify trend shifts and trading opportunities.
A trading indicator that combines CCI/Momentum and RSI to identify potential market reversals by detecting extreme price points and momentum shifts.
Likes, views, and comments are historical TradingView snapshots. They describe attention, not trading performance.