
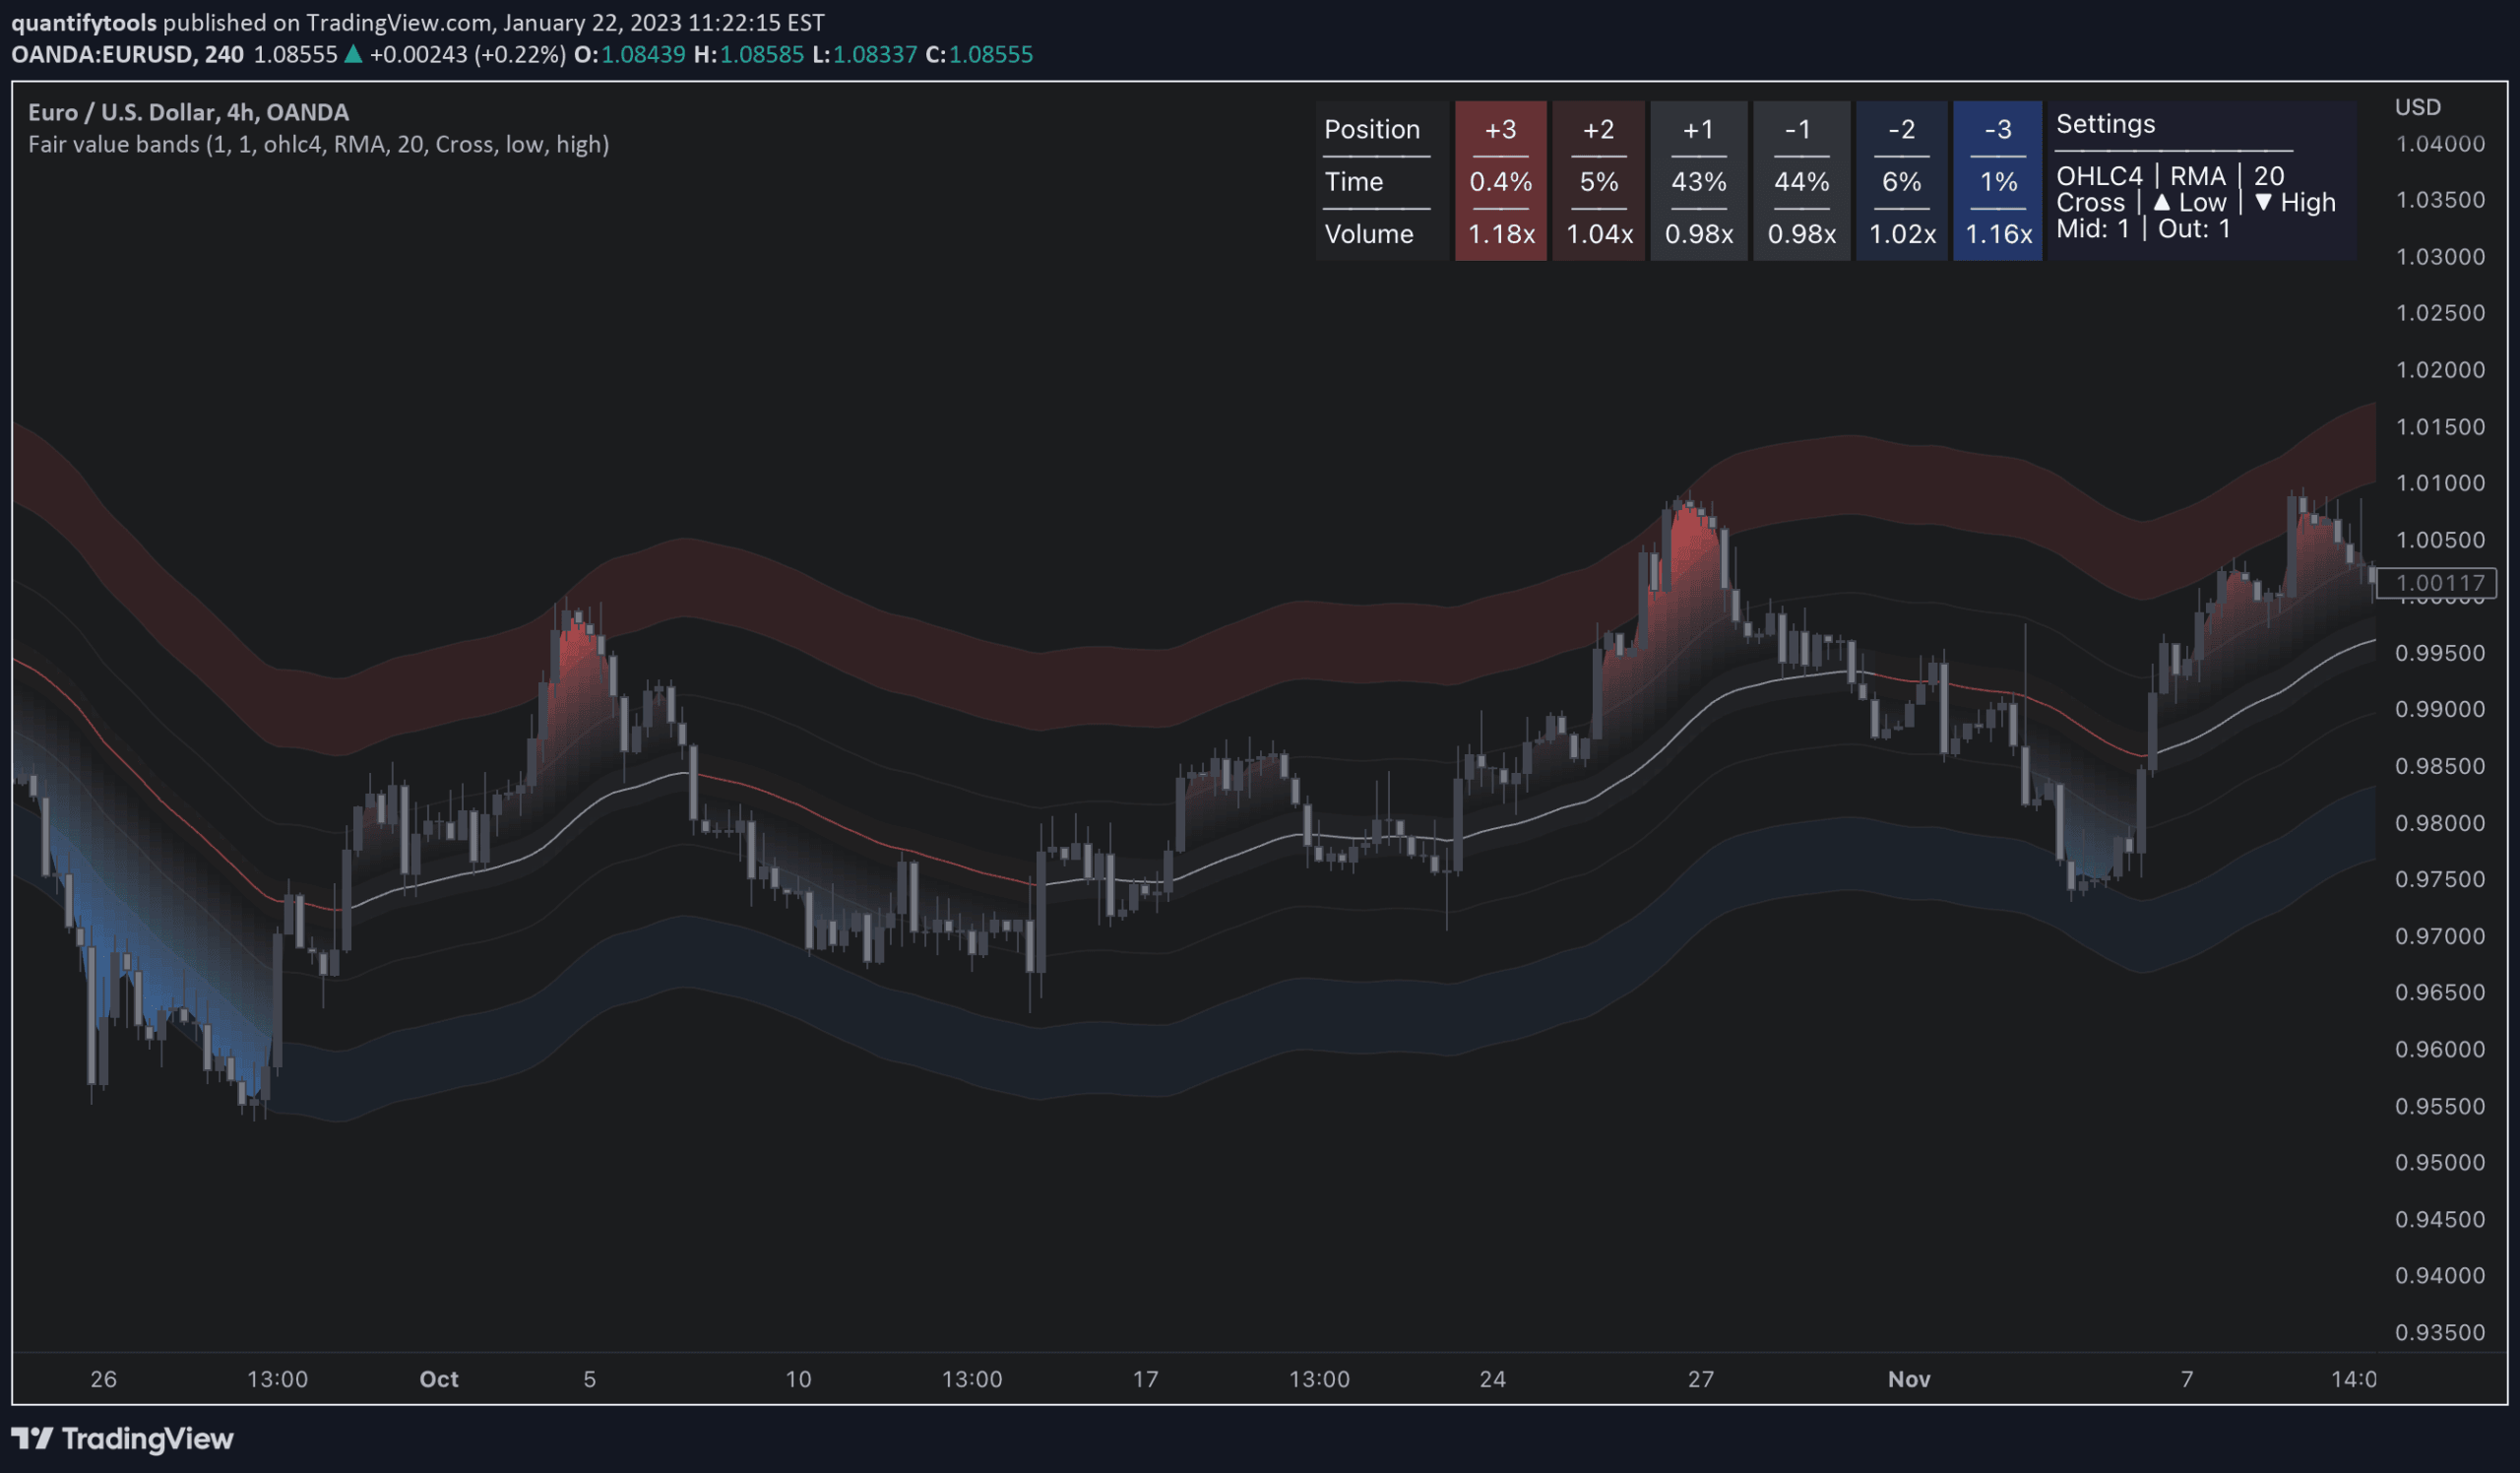
Fair value bands assess price behavior by tracking deviations from a mean basis, helping traders identify normal and abnormal price movements through dynamic statistical bands.
Explore complementary indicator rolesHow it works
Fair value bands calculate price behavior by establishing a mean basis using various price sources like OHLC4 or HL2 and smoothing techniques such as SMA or EMA. The bands create multiple deviation zones (+3, +2, +1, -1, -2, -3) around the central fair value line.
These zones represent typical price movements, with areas closer to the mean considered lower risk and areas further from the mean indicating potential anomalies. The bands dynamically adjust based on historical price deviations, providing a statistical framework for understanding price behavior
Why it may be useful
Fair value bands offer traders a sophisticated method to understand price dynamics beyond traditional indicators. By quantifying price deviations, traders can identify potential trend reversals, mean reversion opportunities, and abnormal market conditions.
The indicator helps distinguish between normal market fluctuations and significant price movements. It provides insights into market volatility, risk levels, and potential entry or exit points. Understanding these bands can improve trading decisions by offering a more nuanced view of price behavior
When to explore it
Fair value bands work best in markets with consistent mean-reverting tendencies and moderate volatility. They are particularly useful during trending markets where price occasionally moves outside normal ranges. Traders can utilize these bands for identifying potential trend continuation or reversal points, setting stop-loss levels, and assessing market momentum.
The indicator is most effective on longer timeframes like daily or weekly charts, where statistical patterns become more reliable. It provides valuable insights during market transitions and can help traders manage risk more effectively
Keep exploring
What we’ve verified
Access, alerts and repainting behaviour have not been independently verified for this indicator. Check the creator’s current publication and settings.
General descriptions and classifications are recovered research. Verified details above identify the specific checks we have completed. Check the creator’s current publication for later changes.


