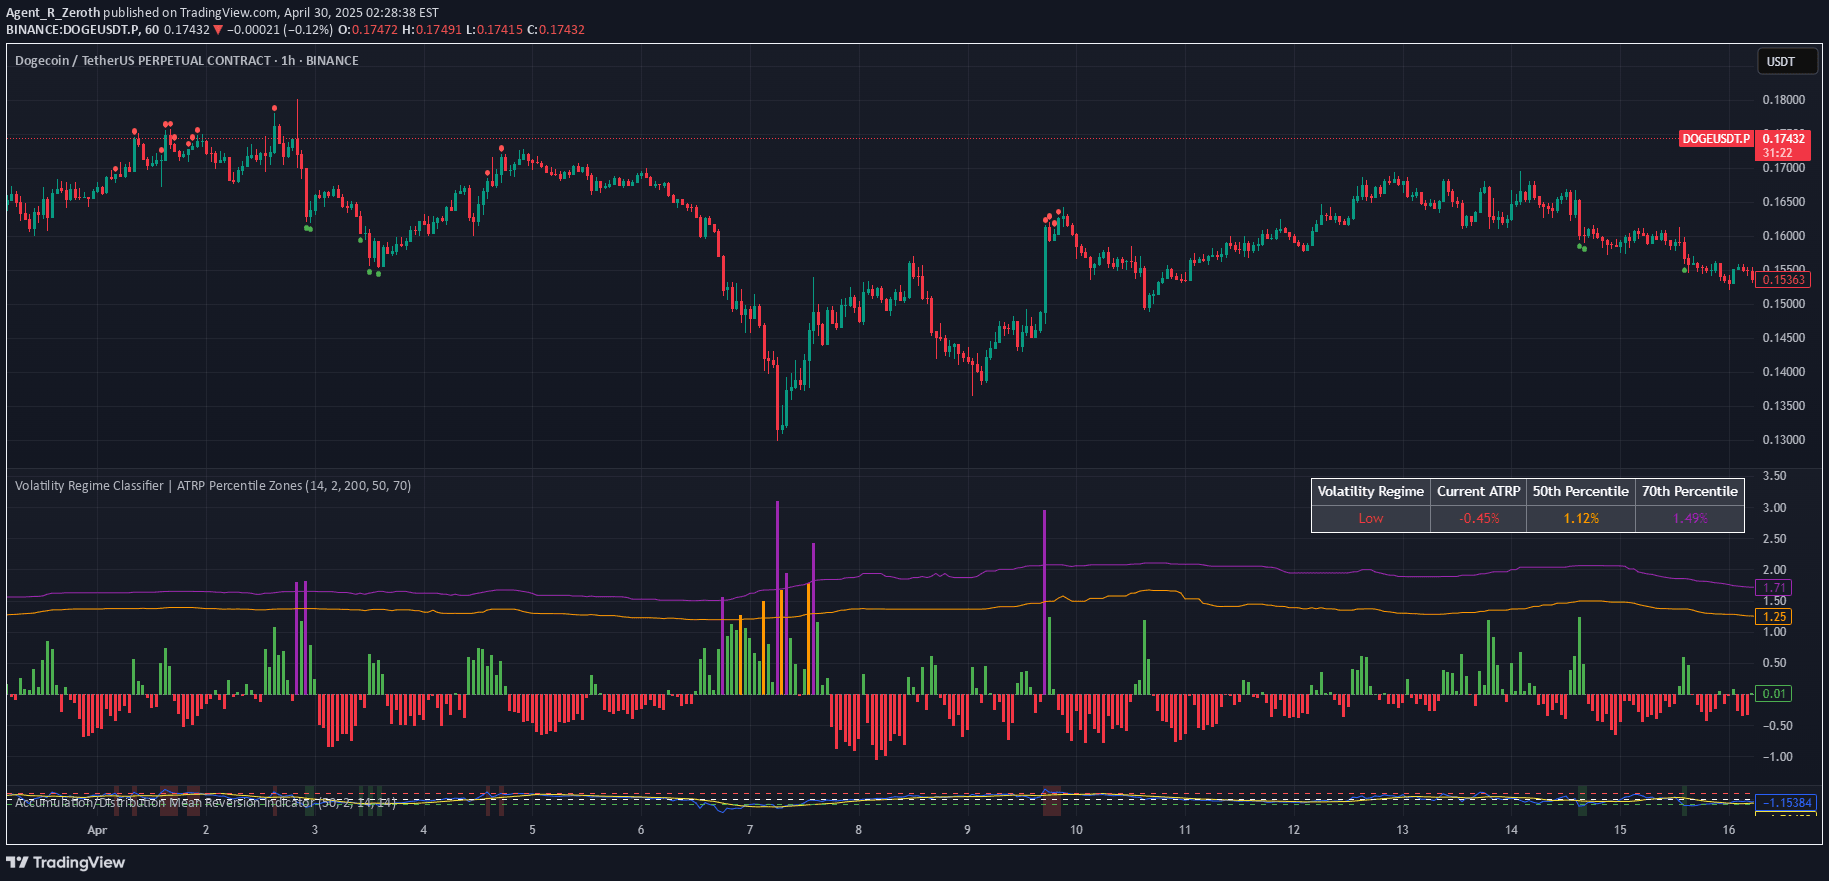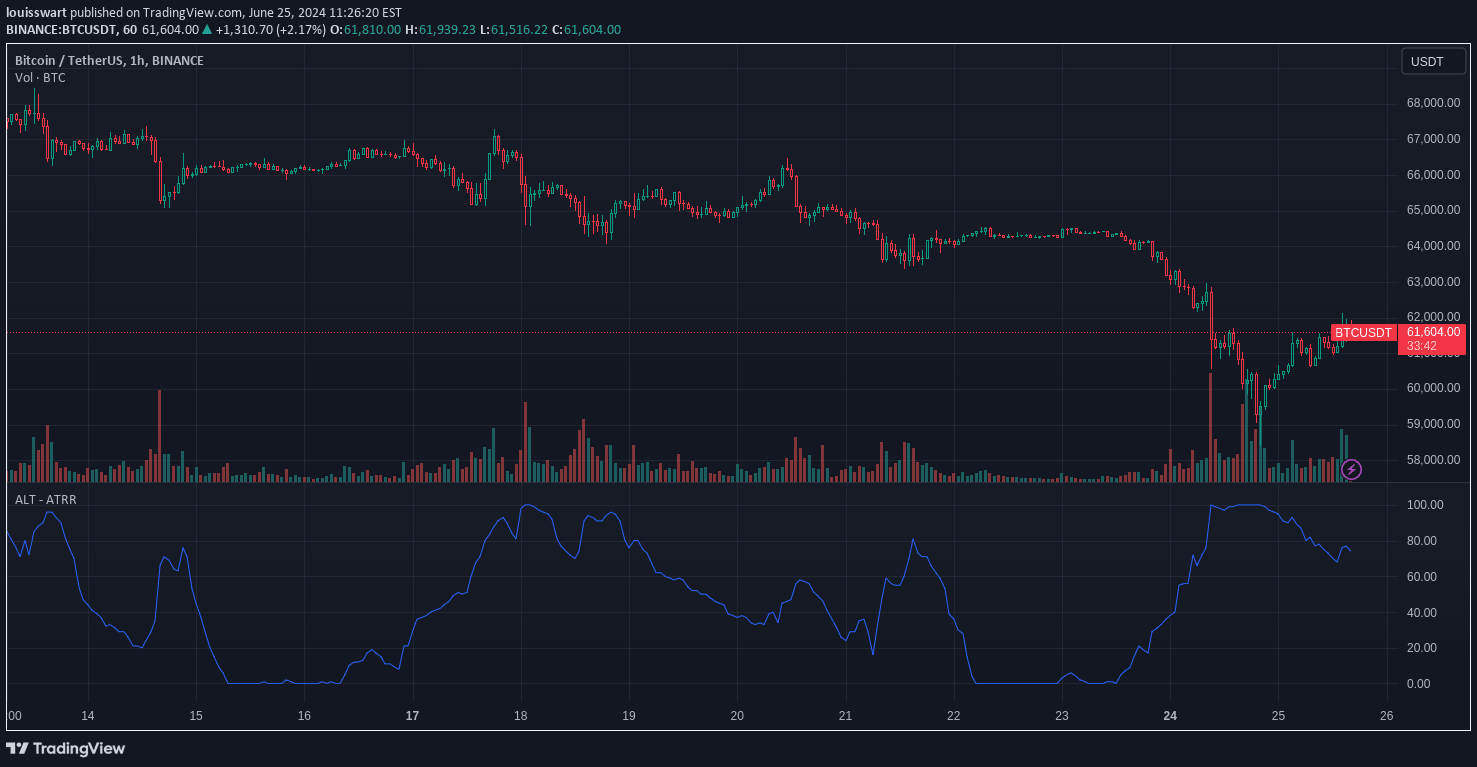
The ALT - ATR Percent Rank indicator measures asset volatility by comparing current Average True Range (ATR) to historical values, helping traders understand market volatility dynamics.
Explore complementary indicator rolesHow it works
The indicator calculates the Average True Range (ATR) over a user-defined number of bars to measure price volatility. It then computes the Percent Rank of the current ATR value by comparing it to ATR values within a specified historical lookback period.
By determining the percentile of the current ATR, traders can quickly understand how the present volatility compares to recent market behavior. The result is plotted as a line on a separate panel, allowing easy visualization of volatility changes across different timeframes and assets.
Why it may be useful
Understanding market volatility is crucial for making informed trading decisions, as it provides insights into potential price movements and market sentiment. The ATR Percent Rank helps traders assess the current market conditions by quantifying volatility relative to historical levels.
By offering a clear, numerical representation of volatility, this indicator enables traders to adapt their strategies, manage risk more effectively, and make more confident entry and exit decisions based on objective market data.
When to explore it
The ALT - ATR Percent Rank is most effective during periods of potential market transitions or when analyzing multiple assets for comparative volatility studies. Traders can use it to confirm trend strength, identify potential breakout opportunities, and assess market conditions across different timeframes.
It is particularly valuable when evaluating risk management strategies, adjusting position sizes, or seeking to understand the underlying market dynamics beyond simple price movement. The indicator provides a nuanced view of market volatility that can complement other technical analysis tools.
Keep exploring
What we’ve verified
Access, alerts and repainting behaviour have not been independently verified for this indicator. Check the creator’s current publication and settings.
General descriptions and classifications are recovered research. Verified details above identify the specific checks we have completed. Check the creator’s current publication for later changes.