
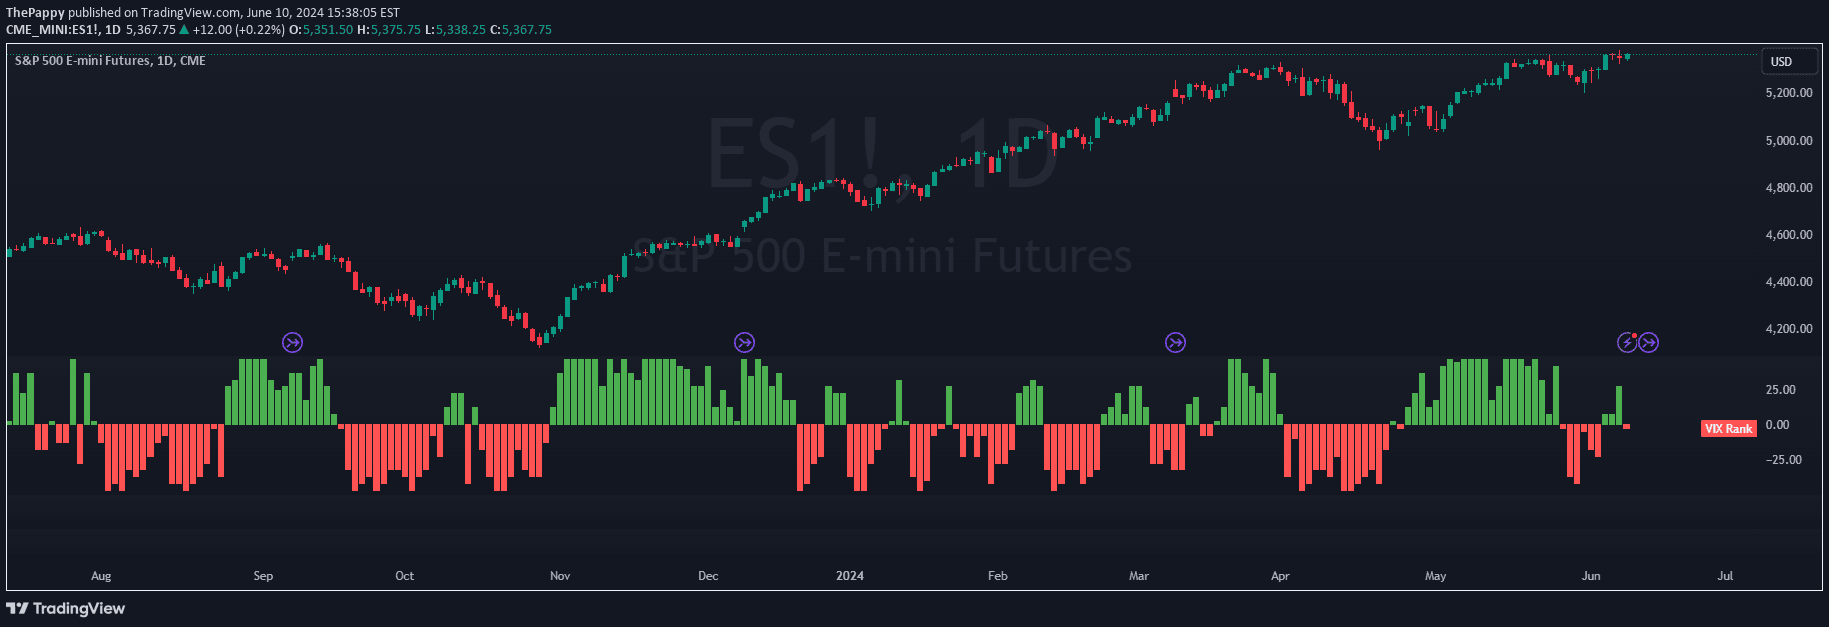
VIX Percentile Rank Histogram visualizes market volatility by tracking the CBOE Volatility Index percentile rank, helping traders assess market sentiment and make informed trading decisions.
Explore complementary indicator rolesHow it works
The VIX Percentile Rank Histogram integrates daily VIX close prices to calculate the percentile rank over a specified lookback period. It uses a statistical method to determine where the current VIX level ranks compared to its recent historical values, creating a comparative analysis of market volatility.
The indicator then visualizes this rank through a histogram, with green bars representing lower-than-median VIX percentile ranks and red bars indicating higher-than-median ranks. A dashed gray line at zero serves as a reference point, helping traders quickly interpret the current market volatility context.
Why it may be useful
The VIX Percentile Rank Histogram provides traders with a nuanced understanding of market sentiment by translating complex volatility data into an easily digestible visual format. By offering insight into market fear and confidence levels, it helps traders make more informed decisions about potential market movements and risk management.
This indicator is particularly valuable because it transforms abstract volatility measurements into actionable intelligence, allowing traders to gauge market psychology and potential trend shifts. The histogram's color-coded visualization makes it simple to quickly assess whether market conditions suggest increased uncertainty or investor confidence.
When to explore it
The VIX Percentile Rank Histogram is most effective when trading S&P 500-related instruments, including SPX, SPY, and ES1! futures, as well as ETFs and Mega Cap stocks that closely track the index. It provides optimal insights during periods of market transition or when assessing potential entry and exit points for trades.
Traders should pay special attention to the histogram when green bars suggest reduced volatility, indicating potential long position opportunities, and when red bars signal increased market uncertainty, suggesting more cautious trading approaches. The customizable lookback period allows traders to align the indicator with their specific trading timeframe and strategy.
Keep exploring
What we’ve verified
Access, alerts and repainting behaviour have not been independently verified for this indicator. Check the creator’s current publication and settings.
General descriptions and classifications are recovered research. Verified details above identify the specific checks we have completed. Check the creator’s current publication for later changes.


