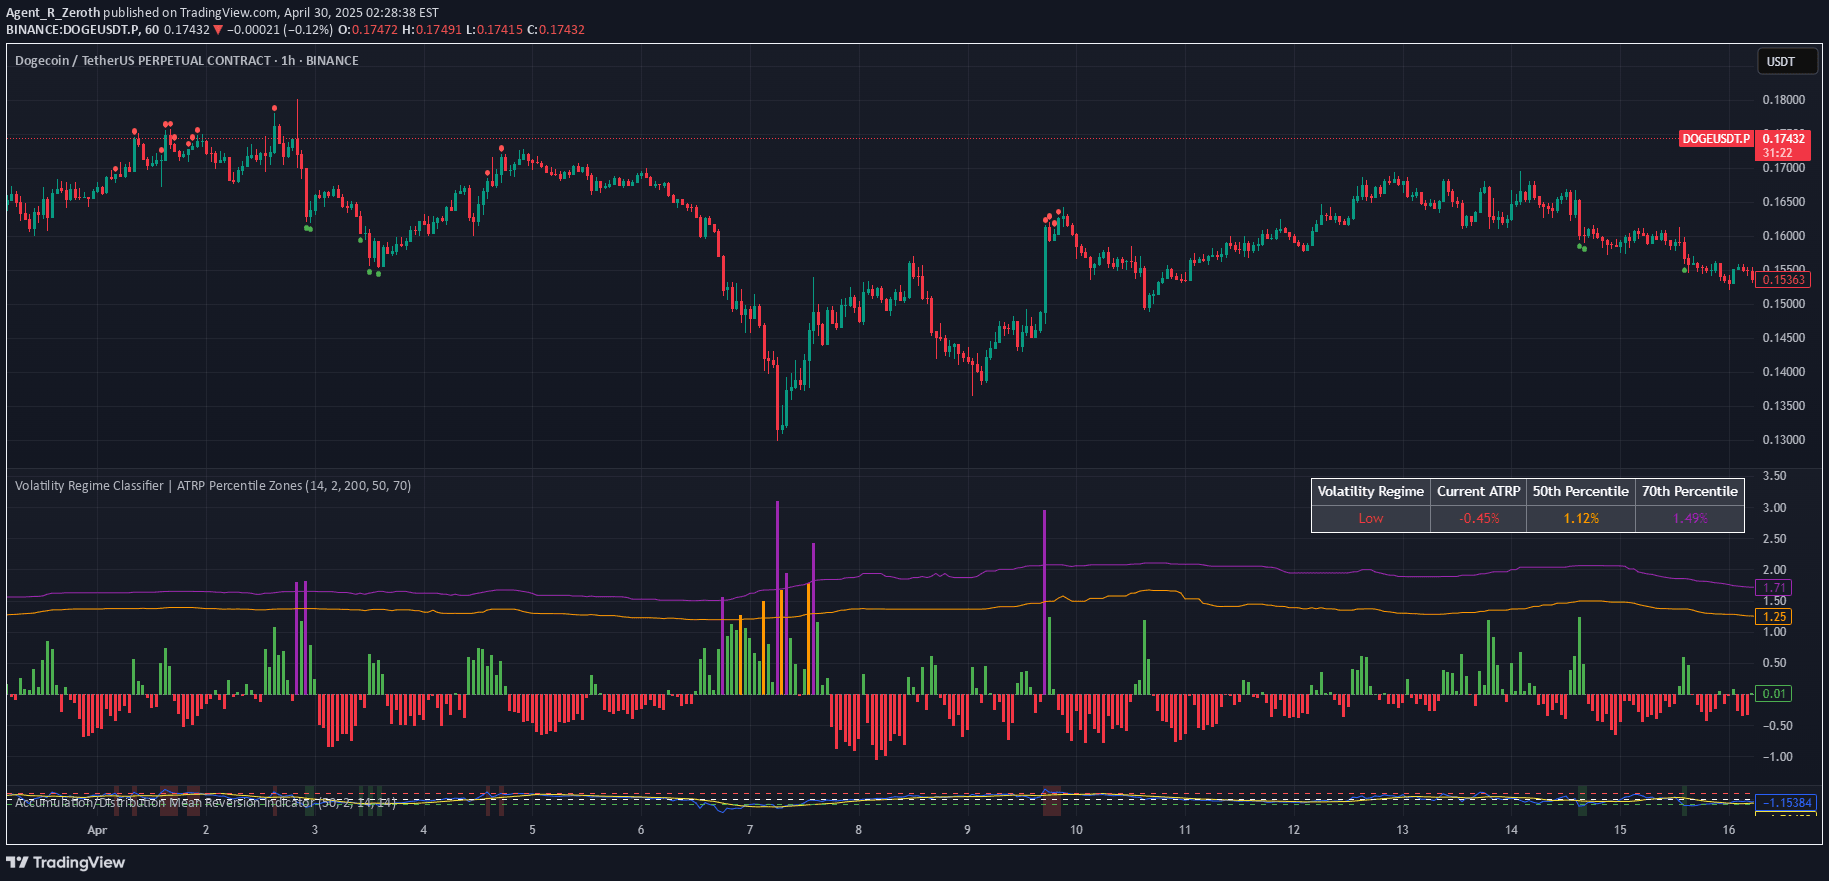
A modified volatility percentile indicator that helps traders identify potential market reversals and trend continuation opportunities by tracking volatility swings across upper and lower swing lines.
Explore complementary indicator rolesHow it works
The volatility percentile indicator tracks market volatility by monitoring crosses between upper and lower swing lines, creating a visual oscillator that maps market transaction volume and intensity. When volatility crosses the upper swing line, it signals a potential significant price level of interest, often indicating a possible market reversal or new trend formation.
After the initial upper swing line cross, the indicator tracks subsequent movements across the lower swing line, revealing two potential market scenarios: a continuation of the primary trend or a corrective wave. Traders can interpret these crosses as signals for potential entry points, with the indicator helping to identify periods of heightened market activity and potential trend shifts.
Why it may be useful
The volatility percentile indicator provides traders with a nuanced view of market dynamics by revealing underlying transaction volume and momentum shifts that might not be immediately apparent from price action alone. By mapping volatility patterns, traders can gain insights into potential trend reversals, market exhaustion, and consolidation periods, which can significantly enhance trading decision-making.
Unlike traditional indicators, this modified version offers a more dynamic interpretation of market movements, allowing traders to understand not just price direction but the intensity and potential sustainability of market trends. It helps traders identify key inflection points where market sentiment might be changing, providing a strategic advantage in timing entries and exits.
When to explore it
This indicator works best on renko charts with specific moving average settings, particularly when tracking markets that exhibit clear trend and consolidation patterns. It is most effective when used in conjunction with other technical analysis tools, helping traders identify potential entry points during significant market transitions or when price is approaching key support and resistance levels.
Traders should be particularly attentive to this indicator during periods of market range-bound behavior, trend reversals, and when price is approaching critical technical levels. It is especially useful for traders looking to capture both trend continuation and potential reversal opportunities, providing a versatile tool for various trading strategies and market conditions.
Keep exploring
What we’ve verified
Access, alerts and repainting behaviour have not been independently verified for this indicator. Check the creator’s current publication and settings.
General descriptions and classifications are recovered research. Verified details above identify the specific checks we have completed. Check the creator’s current publication for later changes.