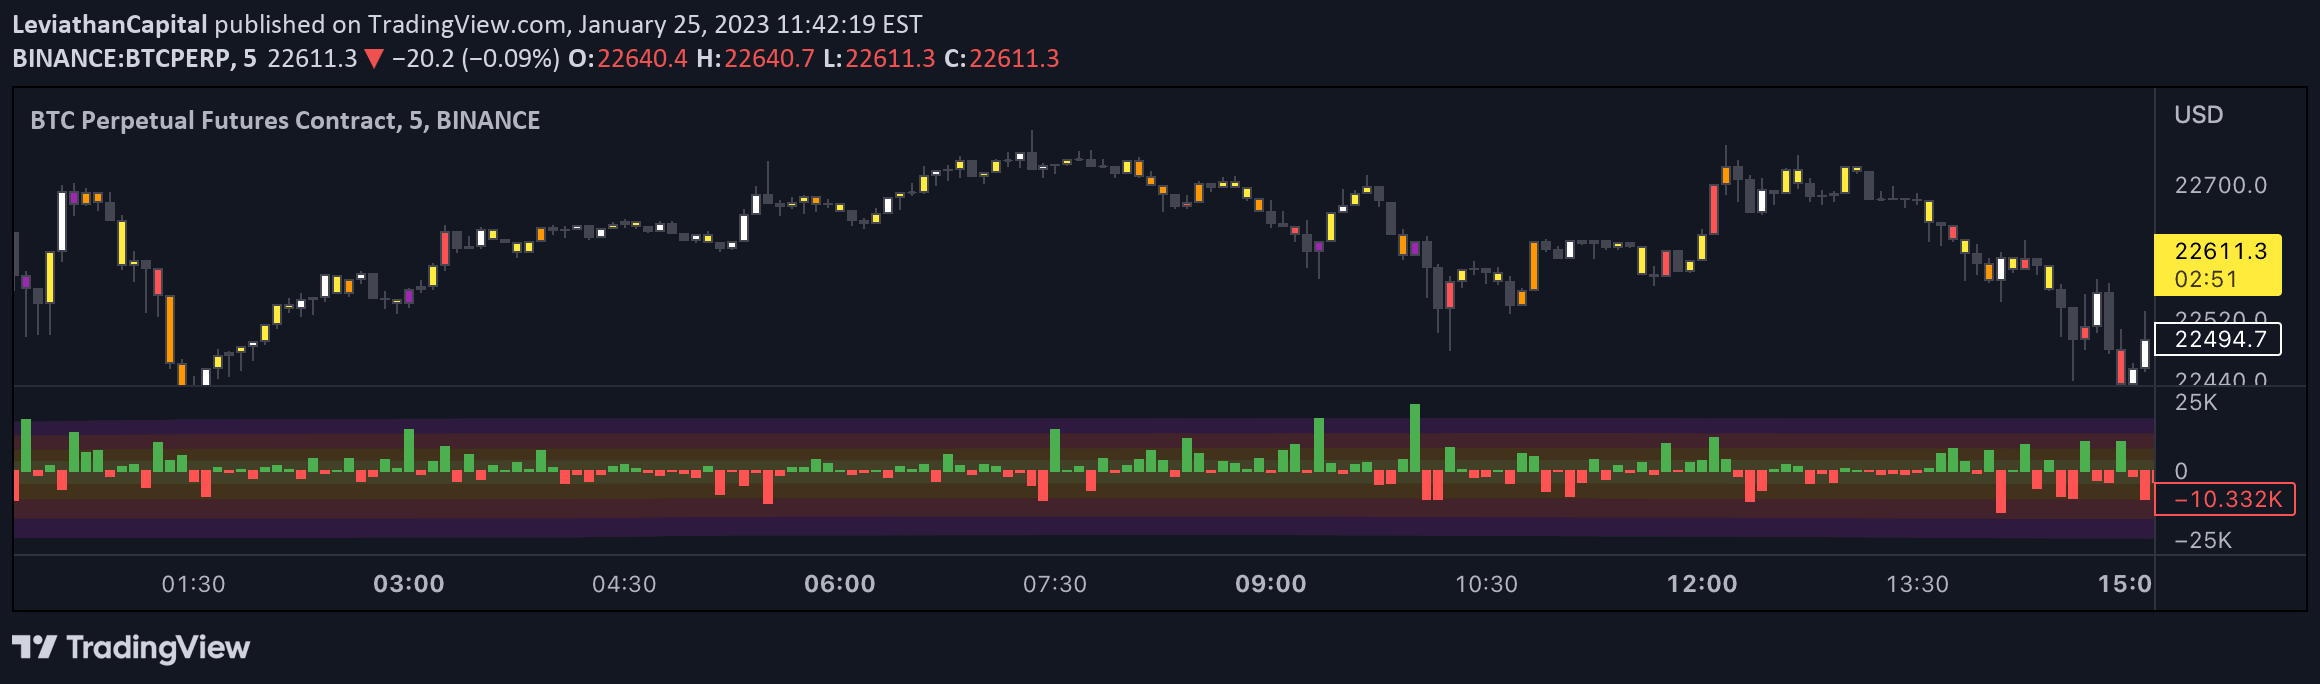
A dynamic volume indicator that measures market sentiment by analyzing delta volume, highlighting unusual buying or selling pressure through histogram visualization.
Explore complementary indicator rolesHow it works
The indicator calculates delta volume by assigning volume to bullish or bearish sides based on price bar direction. When a bar closes higher than its open, all volume is considered bullish; conversely, when it closes lower, volume is marked as bearish.
By tracking these volume assignments, the indicator creates a net volume measure that reveals the strength of buying or selling pressure. It then compares current delta volume against historical averages, calculating standard deviations to identify statistically significant volume shifts that might signal potential market turning points.
Why it may be useful
Delta volume analysis provides traders with insights into market sentiment and potential trend reversals by quantifying the underlying buying and selling dynamics. It offers a nuanced view of market participation that goes beyond simple price movement, helping traders understand the relative strength of market participants.
By highlighting unusual volume patterns, the indicator can serve as an early warning system for potential market shifts. This approach allows traders to detect emerging trends or sentiment changes before they become fully apparent in price action, potentially offering a strategic advantage in decision-making.
When to explore it
This indicator works best in markets with significant trading volume and clear price movements, such as major stock indices, forex pairs, and liquid commodities. It is particularly effective during periods of market transition, where volume patterns might signal potential trend changes or breakouts.
Traders should use this indicator in conjunction with other technical and fundamental analysis tools to confirm signals and reduce false positives. It is most reliable when combined with price action analysis, support and resistance levels, and broader market context to validate potential trading opportunities.
Keep exploring
What we’ve verified
Access, alerts and repainting behaviour have not been independently verified for this indicator. Check the creator’s current publication and settings.
General descriptions and classifications are recovered research. Verified details above identify the specific checks we have completed. Check the creator’s current publication for later changes.