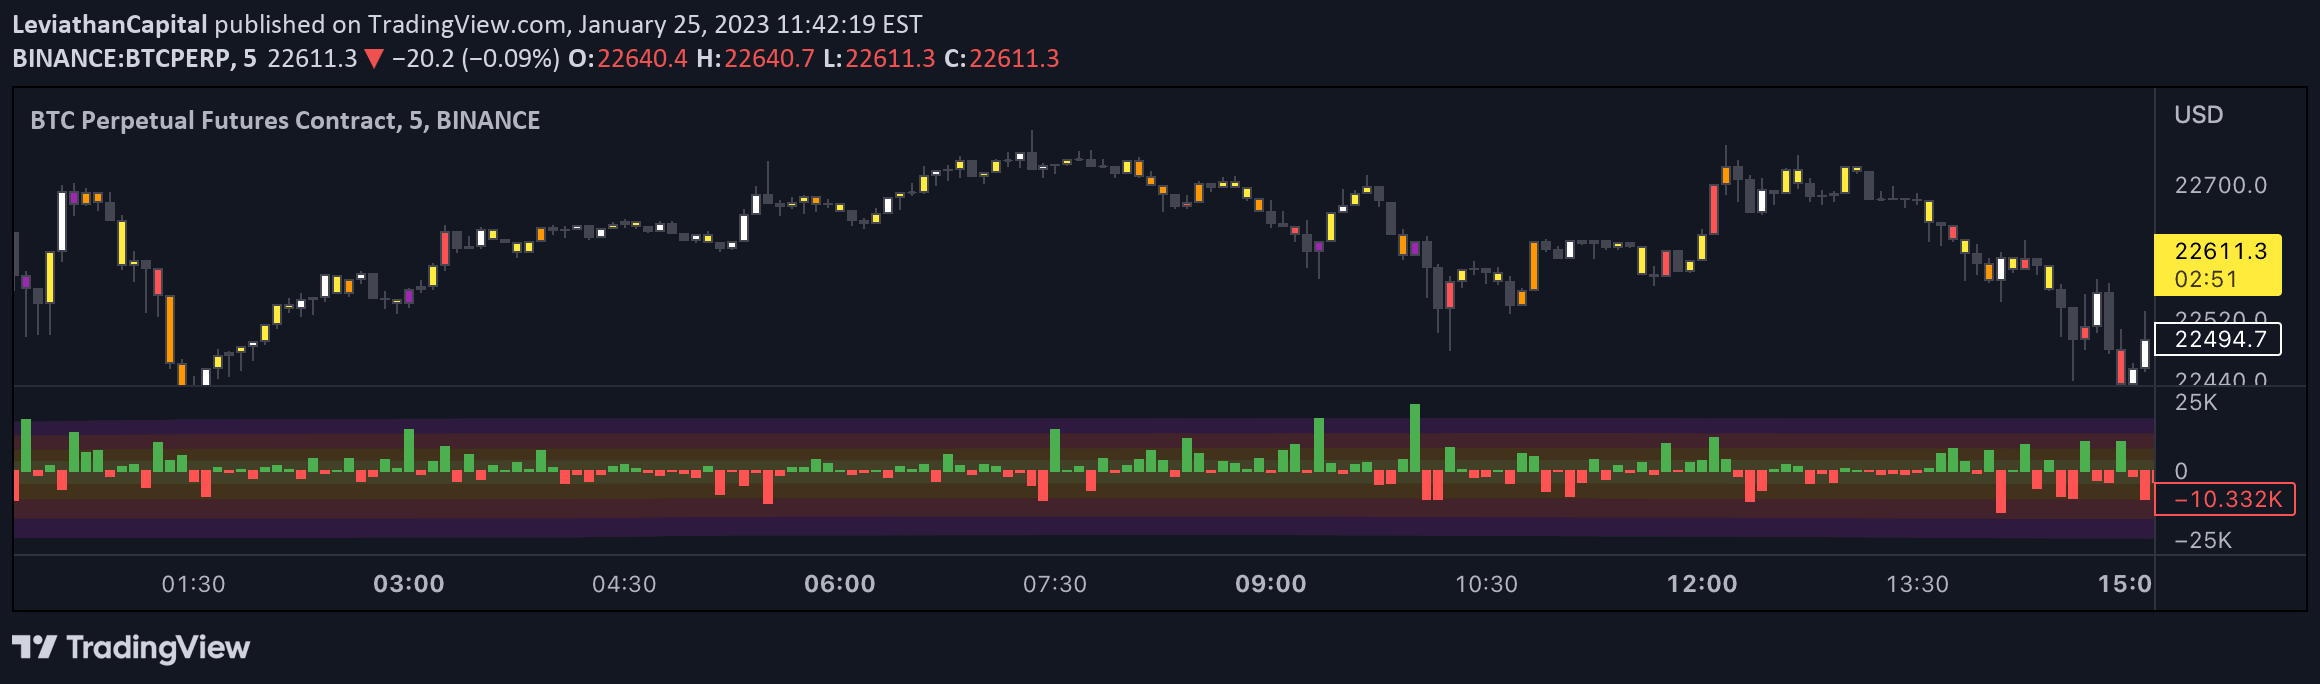
An advanced indicator that calculates correlation between Average True Range (ATR) and On-Balance Volume (OBV), creating a unique line that signals potential market movements and trend changes.
Explore complementary indicator rolesHow it works
The indicator begins by calculating the correlation between the Average True Range (ATR) and the On-Balance Volume (OBV), two critical technical analysis metrics. It computes the difference between positive and negative OBV correlations, creating a unique line that represents market momentum and volume dynamics.
This line is then plotted on a separate panel with predefined UP and DOWN levels. When the correlation difference line crosses these horizontal thresholds, it generates bullish or bearish signals, indicating potential trend shifts or significant market movement opportunities.
Why it may be useful
By combining volume and volatility indicators, this signal provides traders with a sophisticated method of understanding market dynamics beyond traditional price analysis. It offers insights into potential trend reversals by integrating multiple technical indicators, allowing traders to make more informed decisions.
The correlation-based approach helps identify hidden market relationships that might not be apparent through standard technical analysis methods. It bridges the gap between volume, volatility, and price movement, offering a more comprehensive view of market conditions and potential trading opportunities.
When to explore it
This signal is most effective in markets with clear trending characteristics and significant volume fluctuations. It works best in liquid markets like major stock indices, forex pairs, and heavily traded commodities where volume and volatility are consistent and meaningful.
Traders should consider using this indicator during periods of market transition, such as when price is consolidating or showing signs of potential breakout. It is particularly useful for identifying early trend changes and confirming momentum shifts across different timeframes.
Keep exploring
What we’ve verified
Access, alerts and repainting behaviour have not been independently verified for this indicator. Check the creator’s current publication and settings.
General descriptions and classifications are recovered research. Verified details above identify the specific checks we have completed. Check the creator’s current publication for later changes.