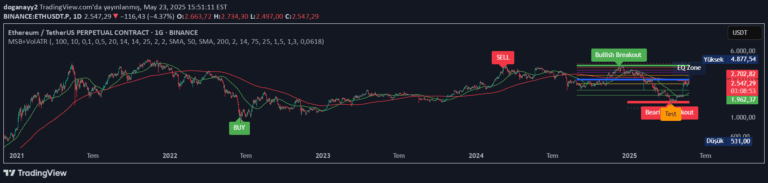
A trading indicator that combines price momentum and volume analysis to identify potential trend reversals or breakouts by checking percentage price changes and volume spikes.
Explore complementary indicator rolesHow it works
The indicator starts by calculating the 1-period Rate of Change (ROC) for closing prices, measuring the percentage price movement. It checks if the absolute ROC meets or exceeds a predefined percentage threshold, typically around 5%. Simultaneously, it compares the current trading volume against a specified volume threshold, such as 1,000,000 shares or contracts.
When both conditions are met, the indicator generates a signal, typically visualized as a purple circle beneath the price bar. If only one condition is satisfied, it can still plot a circle, providing flexibility in signal interpretation. The dual-condition approach helps traders identify potential trend shifts or momentum changes with added volume confirmation.
Why it may be useful
This indicator is crucial because it combines multiple analytical dimensions to provide more robust trade signals. By integrating price momentum and volume analysis, traders can reduce false signals and increase confidence in potential market movements. The approach helps filter out random price fluctuations by requiring both price change and significant trading activity.
The signal's strength lies in its ability to capture market dynamics beyond simple price movements. Volume confirmation adds depth to momentum analysis, helping traders distinguish between genuine trend changes and temporary price noise. This multi-factor approach can improve trade entry and exit decisions across different market conditions.
When to explore it
The indicator works best in markets with clear directional movements and sufficient trading volume. It is particularly effective during periods of market transitions, such as trend reversals or breakout scenarios. Traders should apply this signal in liquid markets where volume data is reliable and price movements are more pronounced.
Optimal usage includes volatile market segments like technology stocks, major currency pairs, or futures contracts. The signal is most powerful when combined with other technical analysis tools, providing additional confirmation for trading decisions. Traders should adjust the percentage and volume thresholds to match specific asset characteristics and market conditions.
Keep exploring
What we’ve verified
Access, alerts and repainting behaviour have not been independently verified for this indicator. Check the creator’s current publication and settings.
General descriptions and classifications are recovered research. Verified details above identify the specific checks we have completed. Check the creator’s current publication for later changes.