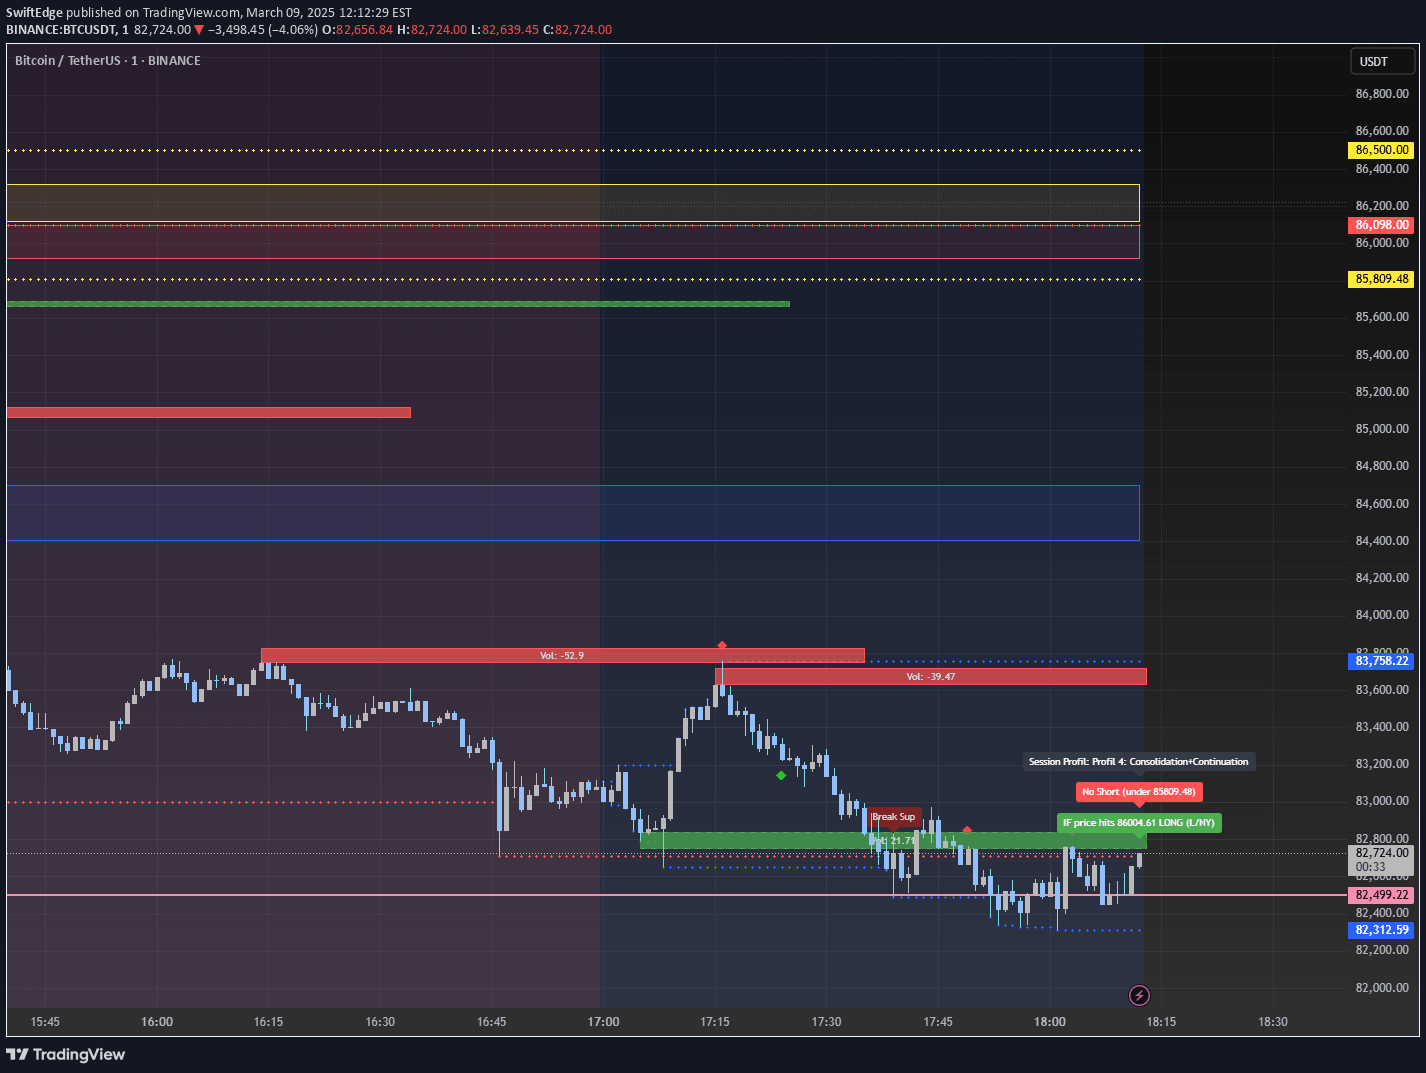
A volume-based trading signal that identifies cumulative volume delta and detects potential price reversals by comparing price action with volume delta trends.
Explore complementary indicator rolesHow it works
The Cumulative Volume Delta (CVD) signal tracks the net volume movement by comparing buying and selling pressure across different timeframes. It uses lower-timeframe volume delta data to create candle-style visualizations that represent net volume direction, with teal candles indicating more buying pressure and red candles showing more selling pressure.
The signal also incorporates divergence detection, identifying potential price reversals by comparing price action with volume delta trends. When price makes a lower low but volume delta shows a higher low, it signals a potential bullish reversal, and conversely, when price makes a higher high but volume delta shows a lower high, it indicates a potential bearish reversal.
Why it may be useful
Volume analysis is crucial for understanding market dynamics and potential trend reversals that might not be immediately apparent from price action alone. By tracking the cumulative volume delta, traders can gain insights into the underlying strength or weakness of price movements, helping them make more informed trading decisions.
The divergence detection feature adds an extra layer of analysis by highlighting potential trend reversals before they become visually obvious. This allows traders to anticipate market shifts and potentially enter or exit trades at more advantageous moments, improving overall trading strategy and risk management.
When to explore it
The CVD signal is most effective in markets with clear volume data and during periods of potential trend transitions. It works particularly well in liquid markets where volume information is readily available and meaningful, such as major stock indices, forex pairs, and high-volume cryptocurrencies.
Traders should use this signal in conjunction with other technical indicators and analysis methods to confirm potential trading signals. It is especially useful for identifying early signs of momentum shifts, detecting weakness in current trends, and providing additional context to price action movements across different trading timeframes.
Keep exploring
What we’ve verified
Access, alerts and repainting behaviour have not been independently verified for this indicator. Check the creator’s current publication and settings.
General descriptions and classifications are recovered research. Verified details above identify the specific checks we have completed. Check the creator’s current publication for later changes.