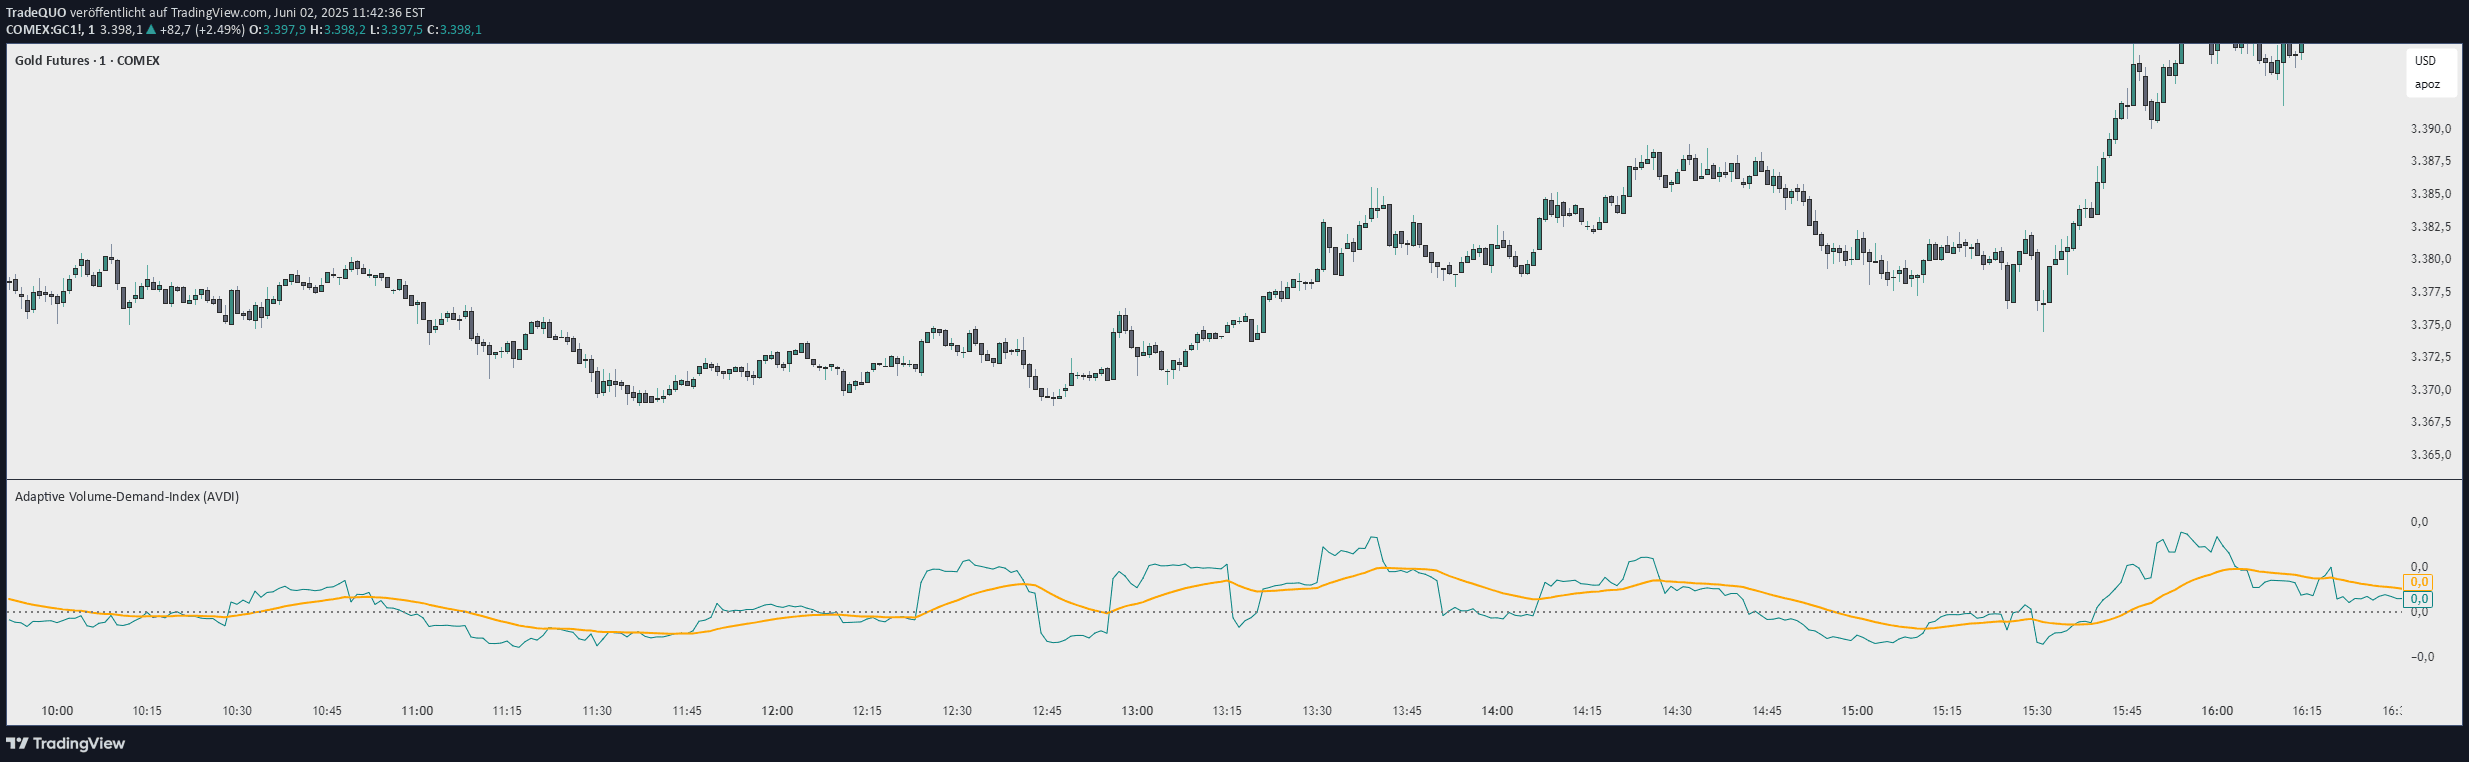
A volume delta histogram that reveals market buying and selling pressure by comparing purchase and sale volumes, with customizable filtering and alert options for traders.
Explore complementary indicator rolesHow it works
The Delta Volume Histogram calculates the difference between buy and sell volumes for a specific trading instrument, creating a visual representation through a histogram. It tracks the net volume flow by subtracting sell volumes from buy volumes, generating positive or negative delta values that indicate market sentiment.
Traders can customize the indicator by setting threshold filters to highlight significant volume delta movements. The histogram allows users to quickly identify periods of strong buying or selling pressure, with color-coded or directional displays that make it easy to interpret market dynamics at a glance.
Why it may be useful
Volume delta provides critical insights into market sentiment by revealing the underlying strength of price movements beyond simple price action. By showing the relative buying and selling pressure, traders can better understand whether a price trend has genuine momentum or might be weak and prone to reversal.
The indicator helps traders make more informed decisions by quantifying market participation and identifying potential trend confirmations or reversals. It offers a transparent view of supply and demand dynamics, allowing traders to gauge market psychology and make more strategic trading choices.
When to explore it
The Delta Volume Histogram is most effective in liquid markets with high trading volumes, such as major stock indices, forex pairs, and actively traded commodities. It works best during periods of active trading when volume data provides meaningful insights into market sentiment and potential price movements.
Traders should use this indicator in conjunction with other technical analysis tools to confirm signals and avoid false positives. It is particularly useful during key market sessions, significant economic announcements, and periods of potential trend changes or breakouts.
Keep exploring
What we’ve verified
Access, alerts and repainting behaviour have not been independently verified for this indicator. Check the creator’s current publication and settings.
General descriptions and classifications are recovered research. Verified details above identify the specific checks we have completed. Check the creator’s current publication for later changes.