
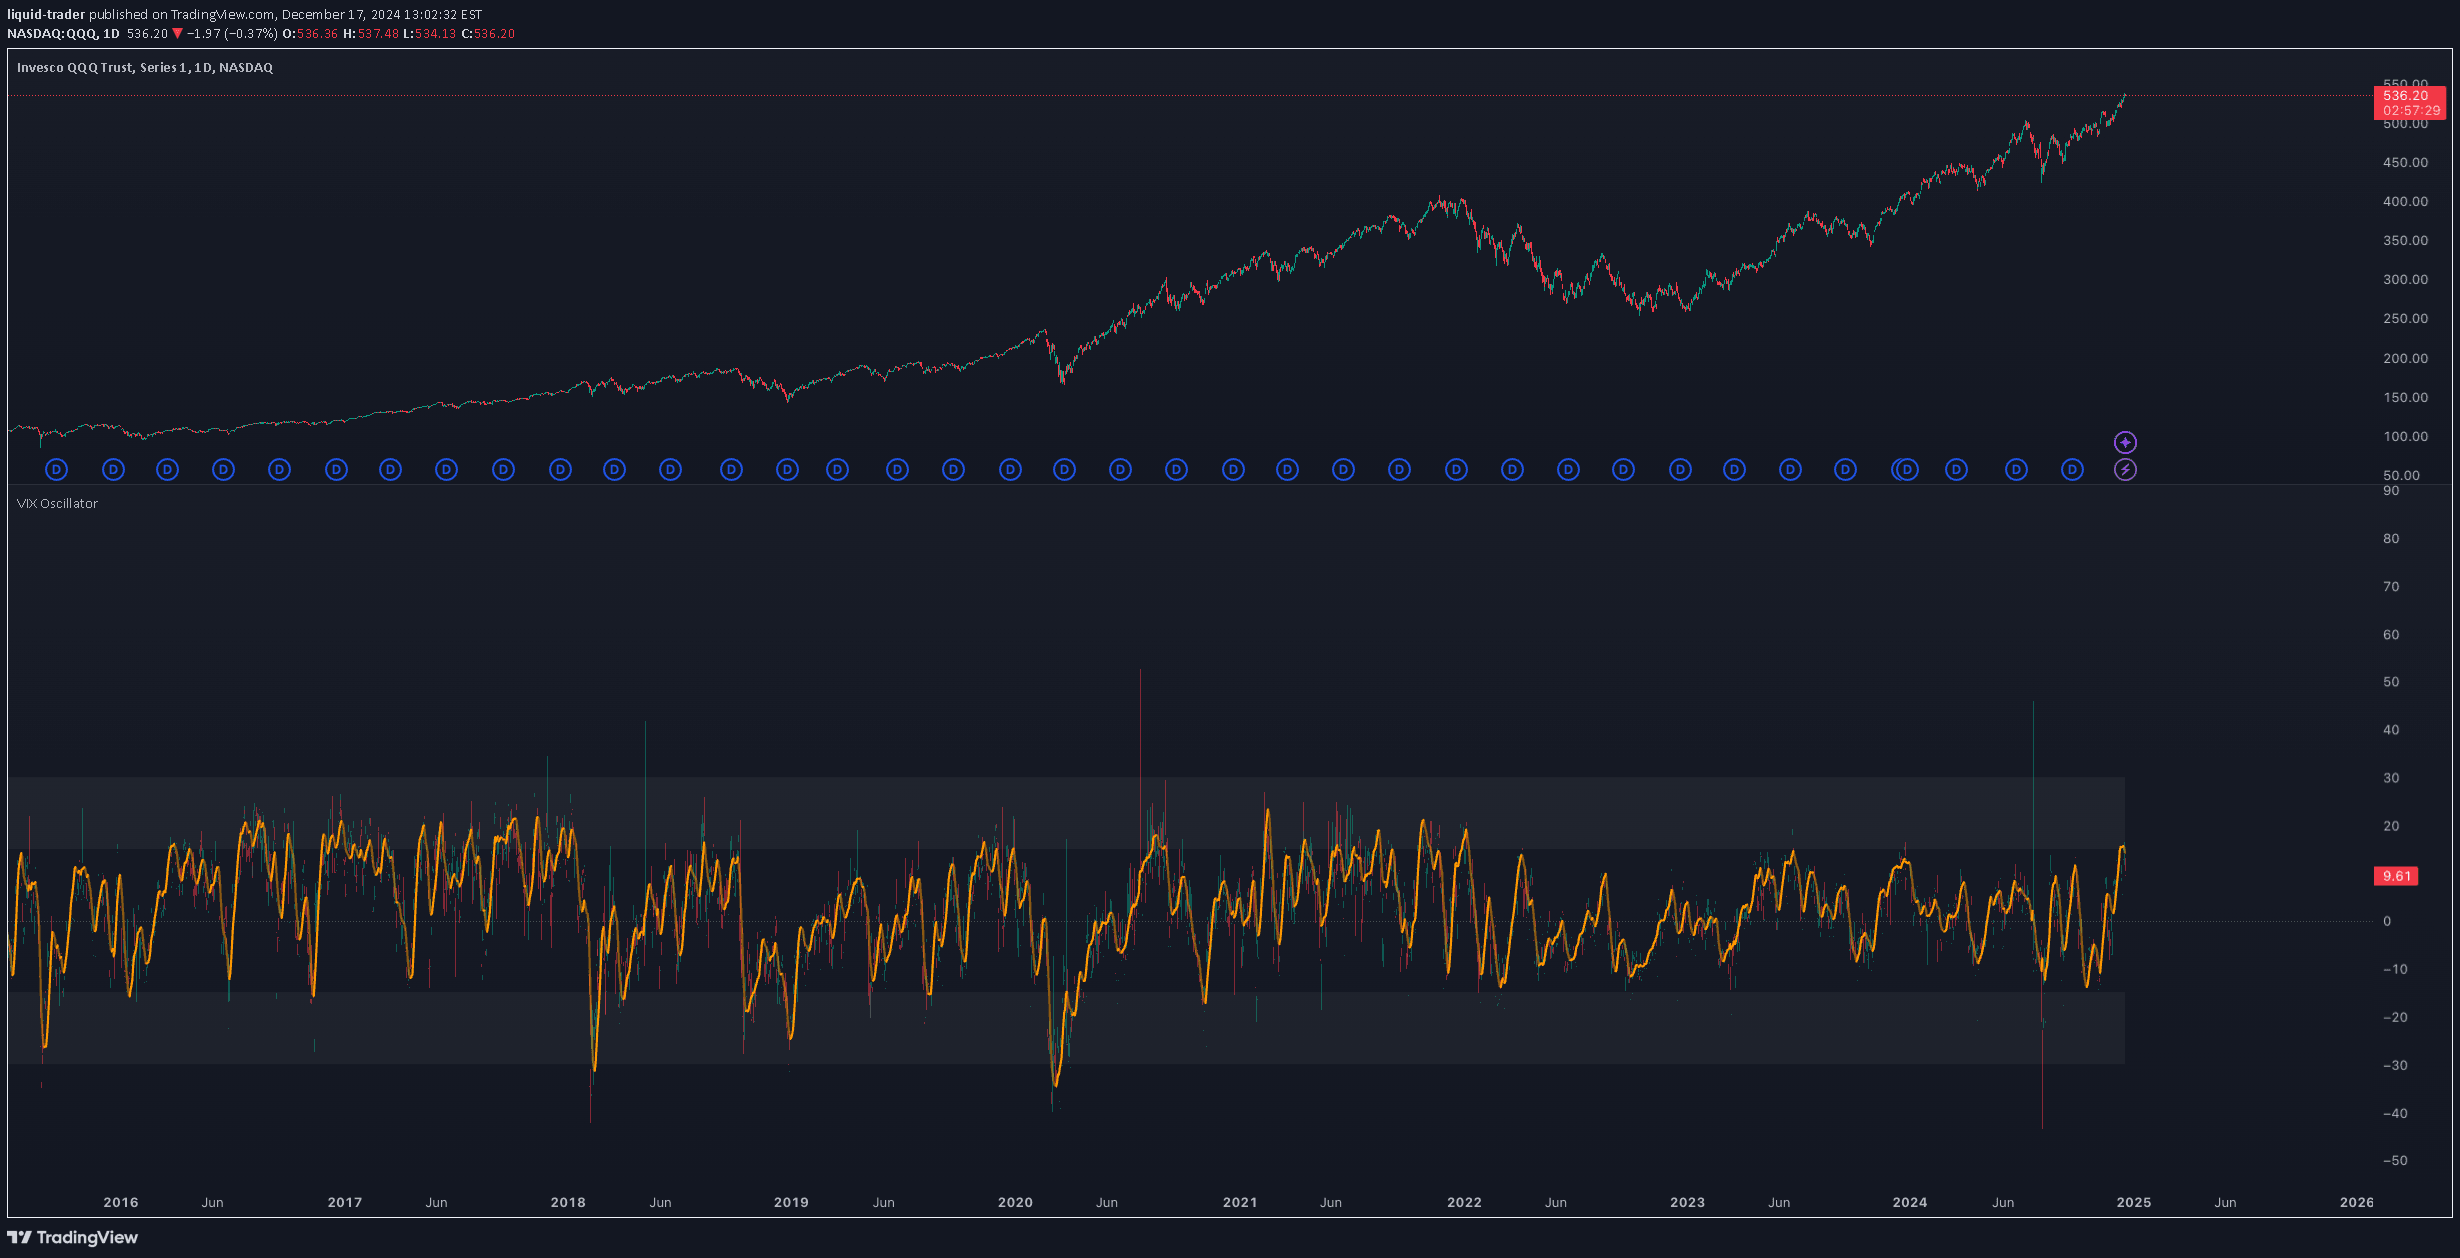
A volatility-based oscillator tracking VIX and VIX3M indices to measure market sentiment and anticipated price movements across different timeframes.
Explore complementary indicator rolesHow it works
The indicator calculates market sentiment by dividing the VIX3M by the VIX and transforming the result into a percentage-based oscillator. It subtracts 1.1 from the quotient and multiplies by 100 to create a centered plot that visually correlates with market direction.
By using two distinct plots - candles and linear regression - the indicator provides a nuanced view of volatility trends. The candles capture precise mathematical calculations, while the linear regression simplifies trend interpretation, allowing traders to quickly assess market sentiment.
Why it may be useful
This volatility oscillator helps traders understand broader market sentiment by translating complex volatility indices into an easily interpretable percentage-based metric. It provides insights into potential market trends and sentiment extremes, enabling more informed trading decisions.
By highlighting bullish and bearish zones, the indicator assists traders in anticipating trend continuations or potential market pivots. Its unique approach of inverting traditional VIX calculations offers a more intuitive visualization of market expectations and potential price movements.
When to explore it
The indicator is most effective for swing traders analyzing higher timeframes like daily charts to identify broader market sentiment shifts. It works best when used in conjunction with other technical analysis tools to confirm potential trend changes or market momentum.
Traders should pay special attention to extreme values above or below zero, as these indicate significant sentiment shifts. The indicator is particularly useful during periods of market uncertainty or when looking to anticipate potential trend reversals across different market conditions.
Keep exploring
What we’ve verified
Access, alerts and repainting behaviour have not been independently verified for this indicator. Check the creator’s current publication and settings.
General descriptions and classifications are recovered research. Verified details above identify the specific checks we have completed. Check the creator’s current publication for later changes.


