
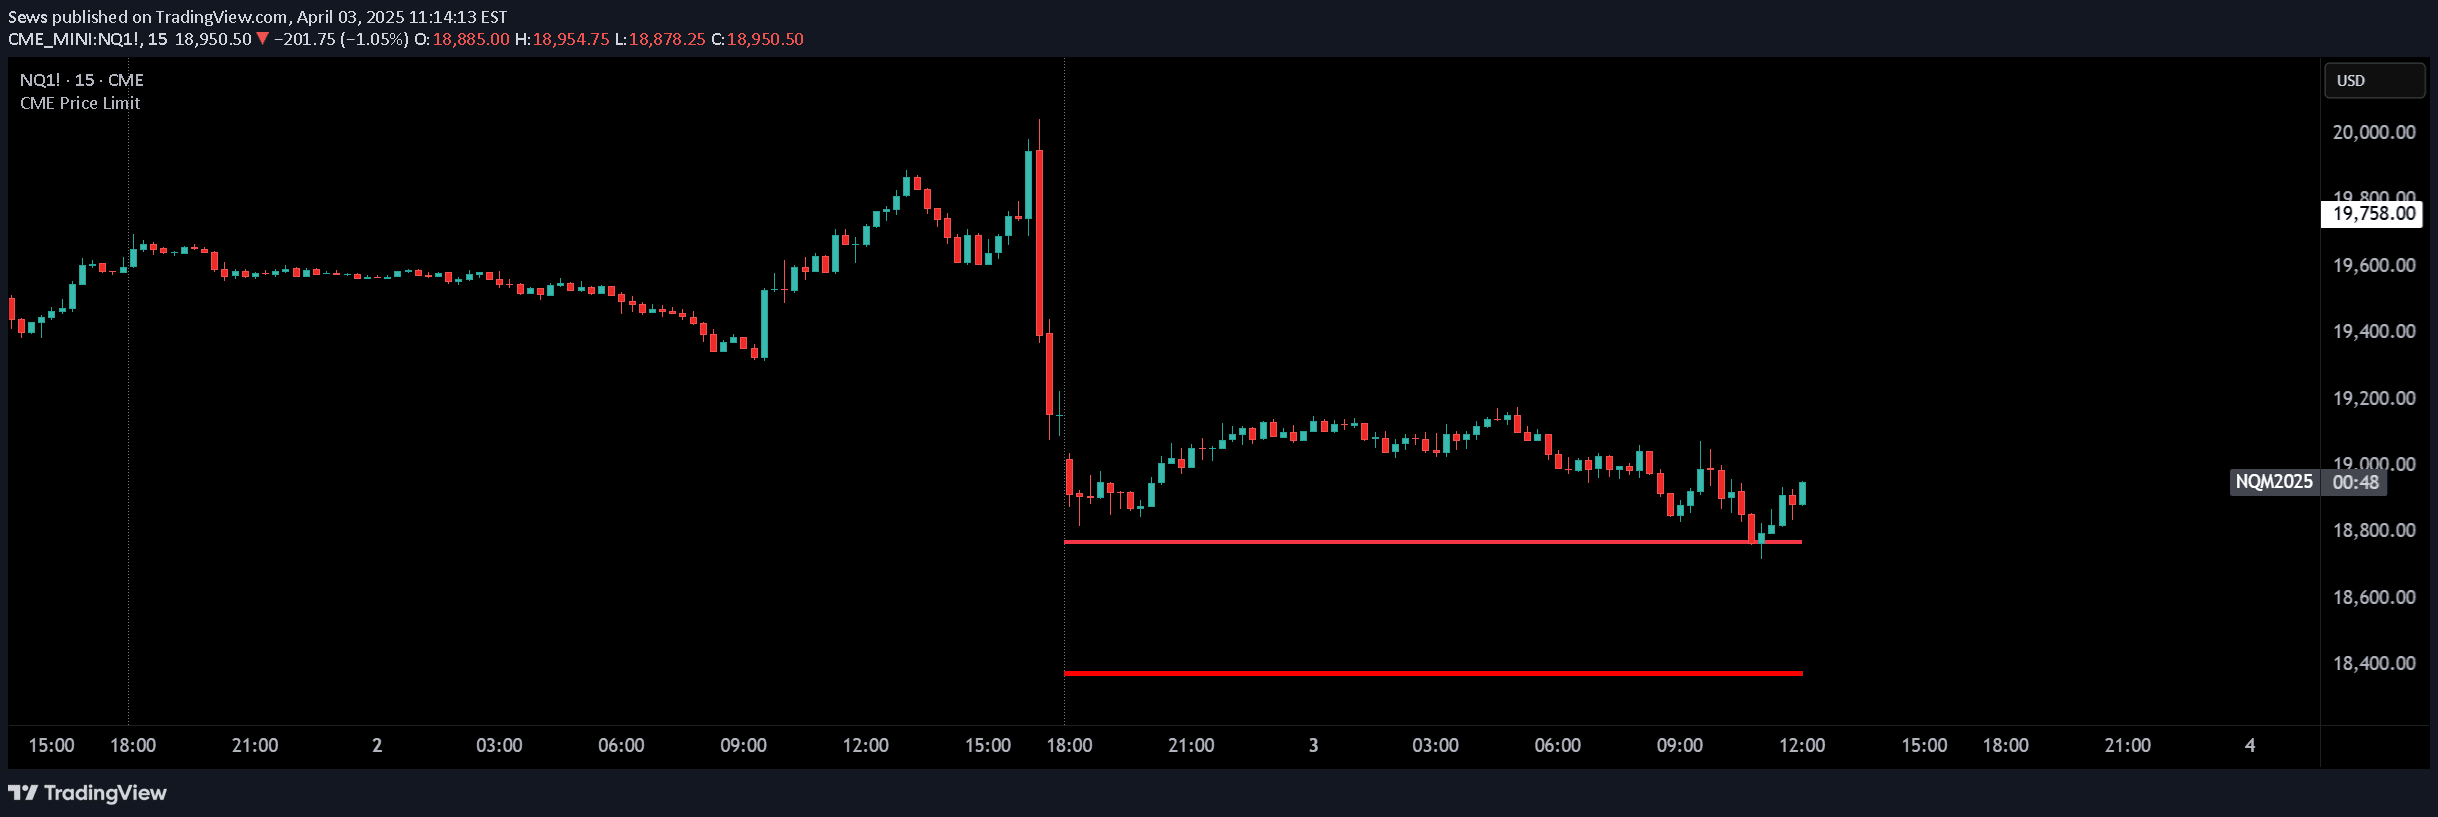
CME Price Limit calculates daily price thresholds for futures contracts using previous day's settlement price. It helps traders identify potential trading boundaries and manage risk during market volatility.
Explore complementary indicator rolesHow it works
The CME Price Limit indicator starts by retrieving the previous day's closing settlement price as a reference point. It then calculates upper and lower price boundaries based on a predetermined percentage limit, which can be customized in the settings.
Traders can enable a buffer zone around these limits for additional context. The indicator can plot historical price limit lines either daily or for the current trading day, providing visual guidance on potential price movement constraints
Why it may be useful
Price limits are crucial for managing risk in futures trading by establishing predefined boundaries that prevent excessive price volatility. They help traders understand potential market constraints and make informed decisions about trade entry and exit points.
By providing clear visual indicators of price movement ranges, traders can better anticipate potential market reactions and adjust their strategies accordingly
When to explore it
The CME Price Limit indicator is most effective during periods of high market volatility or when trading futures contracts with specific exchange-mandated price restrictions.
It is particularly useful for day traders and futures market participants who need to understand potential price movement boundaries. Traders should compare the indicator's reference price with official CME data to ensure accuracy before making trading decisions
Keep exploring
What we’ve verified
Access, alerts and repainting behaviour have not been independently verified for this indicator. Check the creator’s current publication and settings.
General descriptions and classifications are recovered research. Verified details above identify the specific checks we have completed. Check the creator’s current publication for later changes.


