ICT Killzones + Pivots [TFO]
A customizable trading indicator designed to identify ICT Killzones and track high and low price pivots during specific market sessions with configurable time windows.
Explore 11,183 indicators. Filter beyond the obvious.
Discover the tools that fit the way you trade.
11,183 tools to explore
A customizable trading indicator designed to identify ICT Killzones and track high and low price pivots during specific market sessions with configurable time windows.
Auto-generated Fibonacci Retracements that identify market structure shifts and potential support/resistance zones based on technical breaks and price action dynamics.
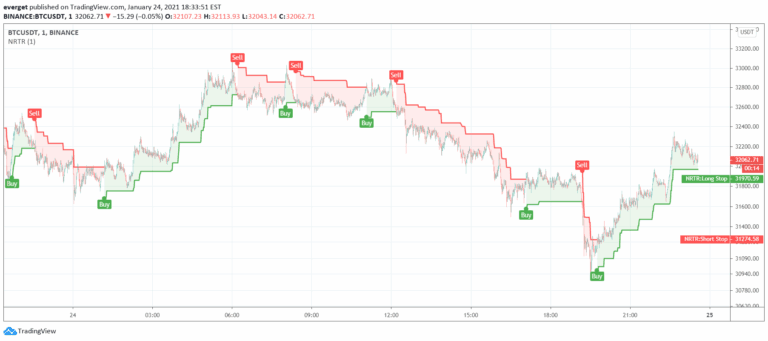
Nick Rypock Trend Reversal (NRTR) is a dynamic price channel indicator that tracks trend direction by measuring price extremes and percentage deviation from peak or bottom.
A trading indicator that detects liquidity sweeps by identifying price breaks through key liquidity levels, highlighting potential support/resistance zones and entry opportunities.
Smart Money Concept (SMC) tracks institutional investor movements, identifying key market structure changes, order blocks, and liquidity zones to reveal potential trading opportunities.
Tick Chart is a unique charting method that creates candlesticks based on a specific number of price ticks, offering an alternative to time-based charts for analyzing market movements.
A customizable market session tracker displaying trading hours for Tokyo, London, New York, and Sydney with multiple visualization options and advanced trading insights.
A trading indicator that calculates volume delta and open interest delta, providing insights into market sentiment and trading activity across different price levels and asset types.
An advanced trading indicator implementing the ICT Turtle Soup strategy, which identifies liquidity zones and market structure shifts to generate precise entry and exit signals for traders.
A trading toolkit focused on identifying market trends and reversals with flexible detection modes and risk management strategies for precise entry and exit points.
An indicator that identifies divergences between swing points of a chart symbol and two external tickers, providing statistical insights into price behavior correlation.
A comprehensive trading toolkit that identifies critical market zones, institutional liquidity levels, and potential price movement patterns using advanced technical analysis techniques.
Likes, views, and comments are historical TradingView snapshots. They describe attention, not trading performance.