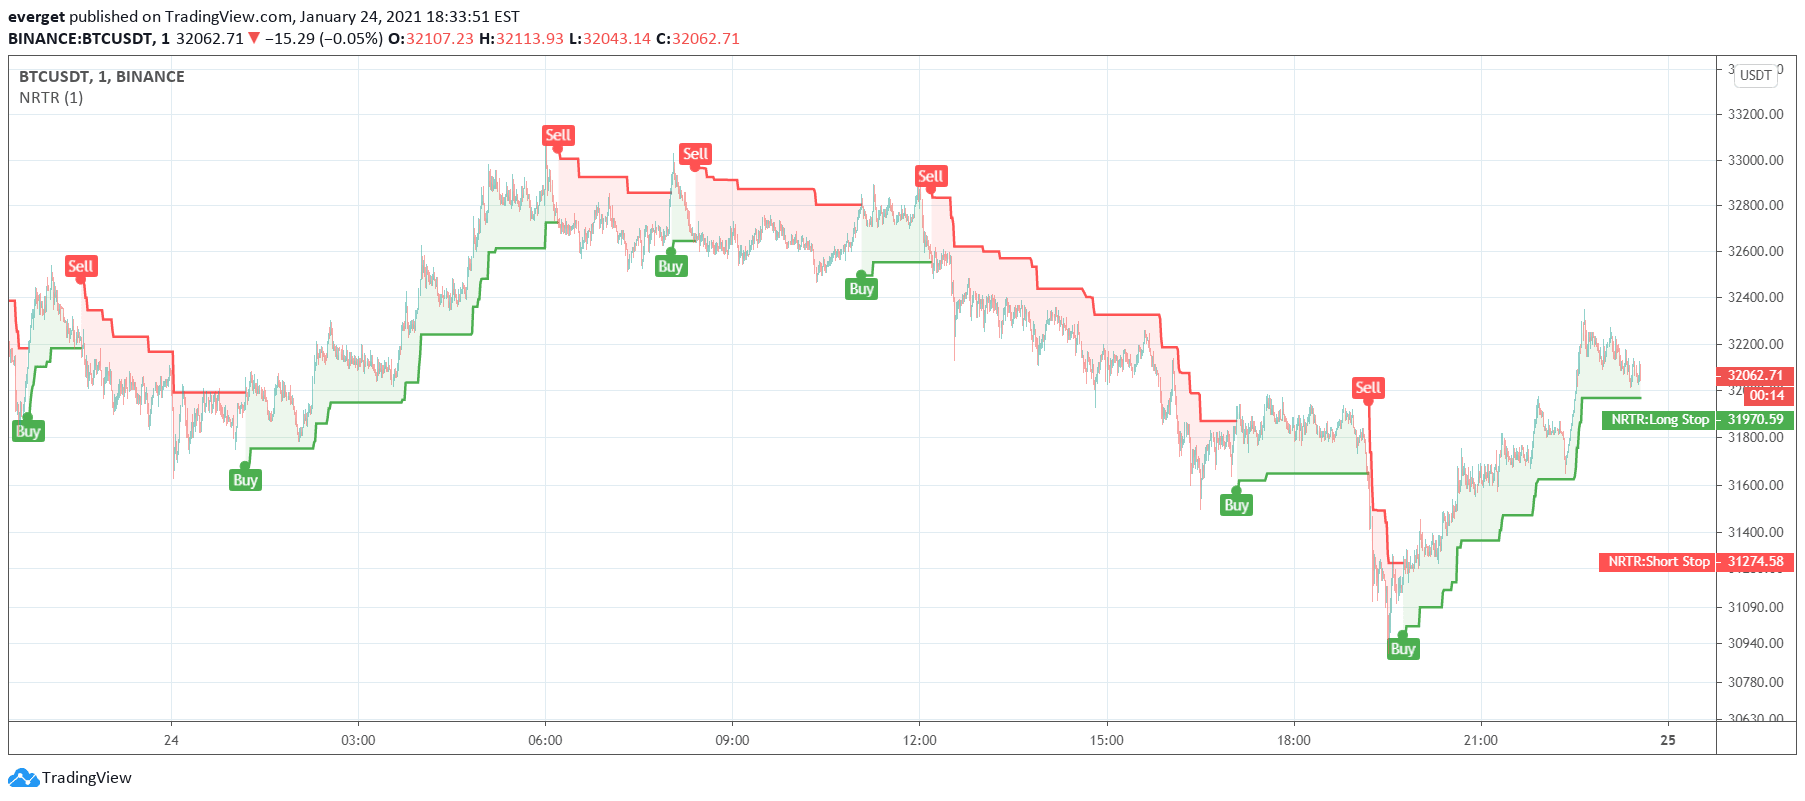
Nick Rypock Trend Reversal (NRTR) is a dynamic price channel indicator that tracks trend direction by measuring price extremes and percentage deviation from peak or bottom.
Explore complementary indicator rolesHow it works
The Nick Rypock Trend Reversal (NRTR) indicator calculates trend direction by creating a dynamic price channel using specific percentage thresholds. It tracks only prices within the current trend, excluding extremes from previous trends. The indicator maintains a consistent percentage distance from price peaks in an uptrend or bottoms in a downtrend.
By filtering out noise and focusing on current trend dynamics, NRTR helps identify potential trend reversals. The percentage-based approach allows for flexible trend analysis across different market conditions. Unlike other indicators like Chandelier Exit, NRTR does not use Average True Range (ATR) for calculations
Why it may be useful
The NRTR indicator provides traders with a unique perspective on trend dynamics by focusing on current price movements and filtering out historical noise. Its percentage-based approach allows for adaptable trend analysis across different market conditions and asset classes. Traders can use NRTR to identify potential trend reversals more effectively than traditional methods.
The indicator helps reduce false signals by considering only prices within the current trend. Its simplicity and dynamic nature make it valuable for understanding market momentum. NRTR can be particularly useful in volatile or ranging markets where traditional trend indicators might generate misleading signals
When to explore it
The Nick Rypock Trend Reversal (NRTR) works best in markets with clear trending characteristics and moderate volatility. It is most effective for swing traders looking to capture multi-day price movements. The indicator performs well in markets like stocks, forex, and futures with consistent price trends.
Traders should use NRTR in conjunction with other technical analysis tools to confirm signals. It is particularly useful during strong bullish or bearish market phases. The indicator may be less reliable in highly choppy or extremely volatile markets. Optimal performance is typically seen in timeframes ranging from daily to weekly charts
Keep exploring
What we’ve verified
Access, alerts and repainting behaviour have not been independently verified for this indicator. Check the creator’s current publication and settings.
General descriptions and classifications are recovered research. Verified details above identify the specific checks we have completed. Check the creator’s current publication for later changes.