
YOUR INDICATOR RESEARCH STARTS HERE

Find the right indicator.
Understand what it does.

Explore 11,183 indicators. Filter beyond the obvious.
Discover the tools that fit the way you trade.

THE INDICATOR LIBRARY

Results for “HILO”

11,183 tools to explore

7 indicators matching your filters
Save search
TrendEditor’s pick

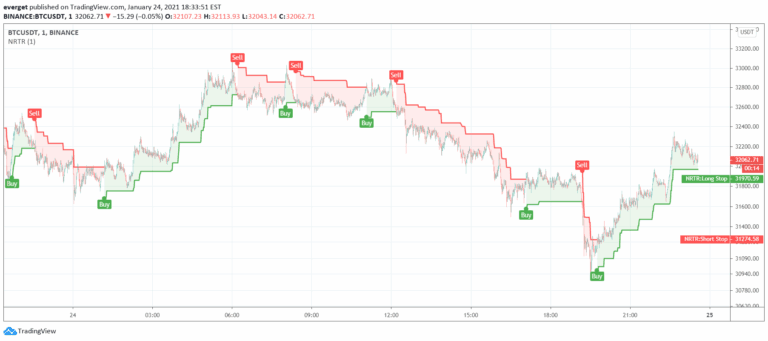
Nick Rypock Trailing Reverse (NRTR)

by everget

Nick Rypock Trend Reversal (NRTR) is a dynamic price channel indicator that tracks trend direction by measuring price extremes and percentage deviation from peak or bottom.

Main price chart · unverifiedSwing Trading
Explore
9.3Klikes126.2Kviews136comments
Save
TrendMomentum

HILO Interpolation | QuantEdgeB

by QuantEdgeB

HILO Interpolation is a dynamic trading signal that uses percentile-based price bands to identify trend shifts and breakouts across different market conditions with adaptive thresholds.

Main price chart · unverifiedDay Trading · Swing Trading
Explore
228likes1.9Kviews0comments
Save
TrendVolatility

HILo Ema Squeeze Bands

by krisoz

A custom EMA-based indicator that identifies price squeezes and potential market moves by using multiple exponential moving averages and creating inner bands with support and resistance zones.

Main price chart · unverifiedDay Trading · Swing Trading
Explore
89likes1.4Kviews5comments
Save
TrendVolatilityChannels

HILo Ema Double Squeeze Bands

by krisoz

A dynamic EMA-based indicator that creates adaptive price channels with quartile divisions to identify potential market moves and provide precise entry and exit points.

Main price chart · unverifiedSwing Trading
Explore
20likes353views1comments
Save
ChannelsTrendVolatility

HiLo EMA Custom bands

by krisoz

A sophisticated technical indicator combining EMAs and custom bands to identify price squeezes, dynamic support/resistance levels, and potential market movement signals across multiple timeframes.

Main price chart · unverifiedSwing Trading
Explore
19likes483views0comments
Save
MomentumSignalTrend

HILOCLOP Analysis

by Kill_Streak

A multi-dimensional price analysis indicator that examines high, low, open, and close values to identify market trends, momentum shifts, and potential breakout conditions.

Separate pane · unverifiedScalping · Day Trading
Explore
17likes850views0comments
Save

Likes, views, and comments are historical TradingView snapshots. They describe attention, not trading performance.

START WITH A QUESTION

A little less searching.
A lot more understanding.

Tell DeepAlpha what you need. Get an explanation, a shortlist,
and a direct path to the indicators behind it.

Ask DeepAlpha