
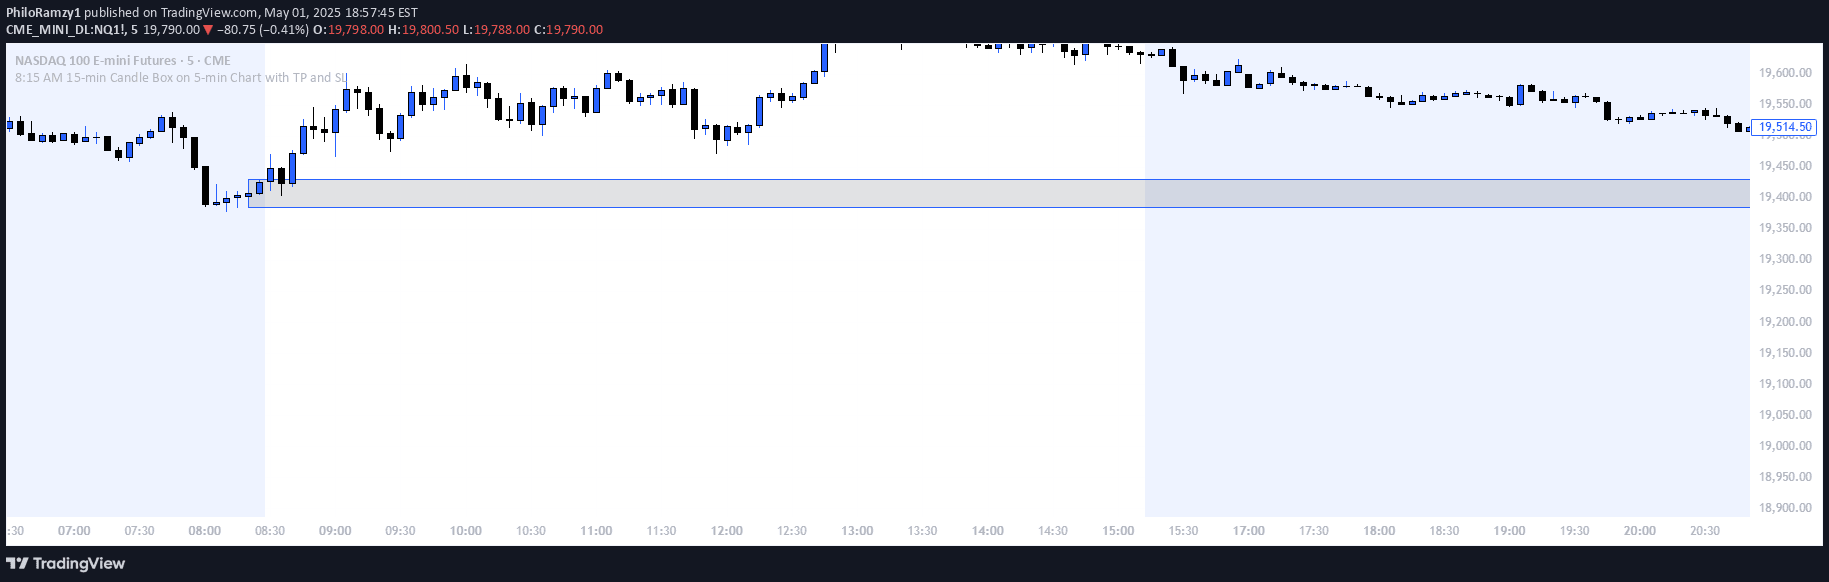
A pre-market breakout trading indicator that tracks the 8:15-8:30 AM candle range, automatically detecting breakouts and setting take profit and stop loss levels.
Explore complementary indicator rolesHow it works
The indicator focuses on the 15-minute candle starting at 8:15 AM Central Time, marking its high and low points to create a breakout box. At 8:30 AM, it draws a visual box extending 8 hours into the trading session, which serves as a key reference point for potential price movements.
When price action occurs, the indicator automatically generates trading signals based on price interactions with the box. A close above the box's high triggers a buy signal, while a close below the low triggers a sell signal, with predefined take profit and stop loss levels set at 50 and 40 pips respectively.
Why it may be useful
This indicator provides traders with a structured, visual approach to identifying potential breakout opportunities during the critical pre-market and early trading hours. By automating the identification of key price ranges and potential entry points, it removes subjective decision-making and offers a systematic trading strategy.
The color-coded feedback system adds an additional layer of information, quickly communicating trade status through visual cues. Traders benefit from clear, predefined risk management parameters and an objective method for detecting market momentum during a typically volatile trading period.
When to explore it
The indicator is most effective for traders focused on U.S. market pre-open and early morning trading, particularly for assets like NASDAQ Futures. It works best in markets with significant early morning volatility and clear directional movements during the first hours of trading.
Traders should use this tool when seeking a structured, rule-based approach to breakout trading that minimizes manual analysis and provides clear, automated entry and exit signals. It is particularly suited for those who want a systematic method to capitalize on price action around market open.
Keep exploring
What we’ve verified
Access, alerts and repainting behaviour have not been independently verified for this indicator. Check the creator’s current publication and settings.
General descriptions and classifications are recovered research. Verified details above identify the specific checks we have completed. Check the creator’s current publication for later changes.


