A Bitcoin trading indicator using Bollinger Bands and RSI to identify mean-reversion opportunities, generating buy and sell signals on 15-minute timeframes for cryptocurrency trading.
Explore complementary indicator rolesHow it works
The indicator combines Bollinger Bands and Relative Strength Index (RSI) to identify potential mean-reversion opportunities in Bitcoin trading. It uses a 20-period Bollinger Band with a 2.2 multiplier to detect overextended price movements, creating buy signals when price drops below the lower band and sell signals when price rises above the upper band.
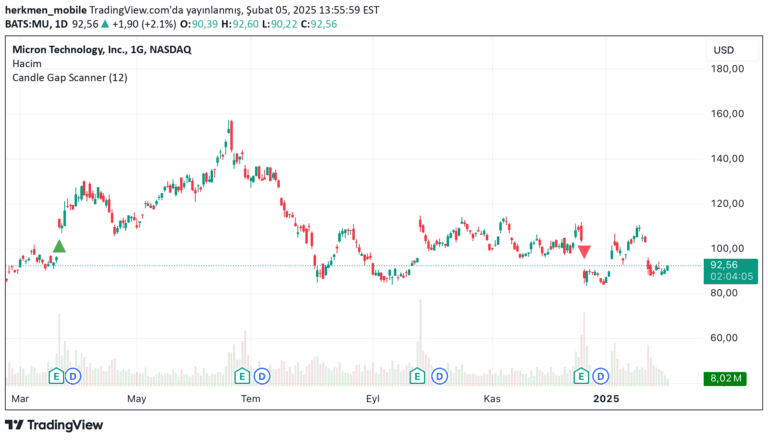
The RSI component adds momentum confirmation by requiring additional conditions: a buy signal needs RSI below 30, while a sell signal requires RSI above 70. The strategy visually displays these signals as green upward triangles for buy opportunities and red downward triangles for sell opportunities, helping traders quickly identify potential entry and exit points.
Why it may be useful
This trading signal provides traders with a systematic approach to navigating the volatile Bitcoin market by combining multiple technical indicators to reduce false signals and improve trade accuracy. By using Bollinger Bands and RSI together, traders can identify potential mean-reversion opportunities with greater confidence, helping to minimize emotional decision-making and providing a structured trading methodology.
The indicator's visual design with color-coded triangles makes it easy for traders to quickly understand market conditions, while the underlying mathematical approach helps traders capitalize on Bitcoin's tendency to return to average price levels after significant movements.
When to explore it
This indicator is most effective in ranging or choppy market conditions where Bitcoin is moving sideways without a strong directional trend. It works best on 15-minute timeframes, allowing traders to capture short-term price movements and potential mean-reversion opportunities in the cryptocurrency market.
Traders should be cautious about using this signal during strong trending markets, where mean-reversion strategies might be less reliable. It is particularly useful during periods of lower trading volume, such as the Asian trading session, and can be enhanced by adding additional confirmation signals like volume spikes or complementary candlestick patterns.
Keep exploring
What we’ve verified
Access, alerts and repainting behaviour have not been independently verified for this indicator. Check the creator’s current publication and settings.
General descriptions and classifications are recovered research. Verified details above identify the specific checks we have completed. Check the creator’s current publication for later changes.