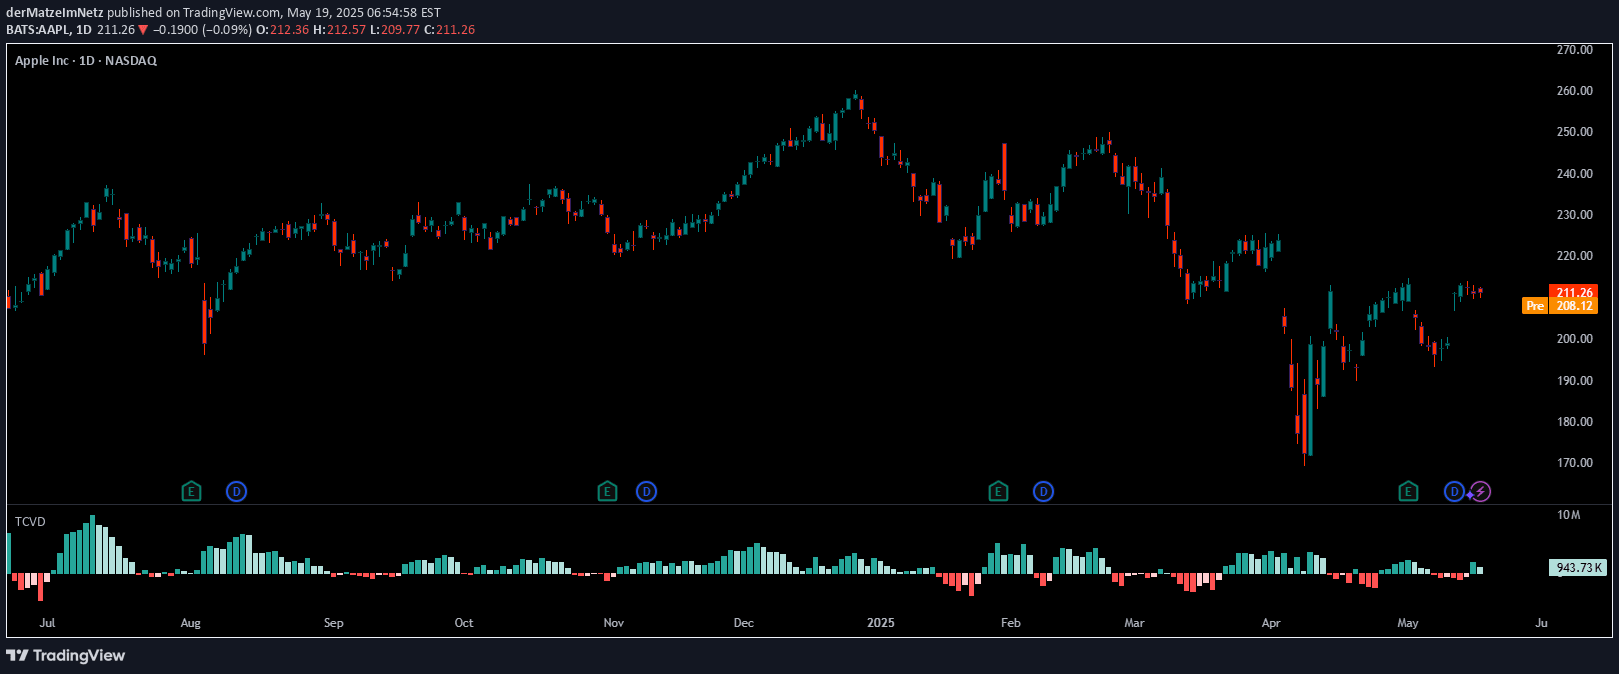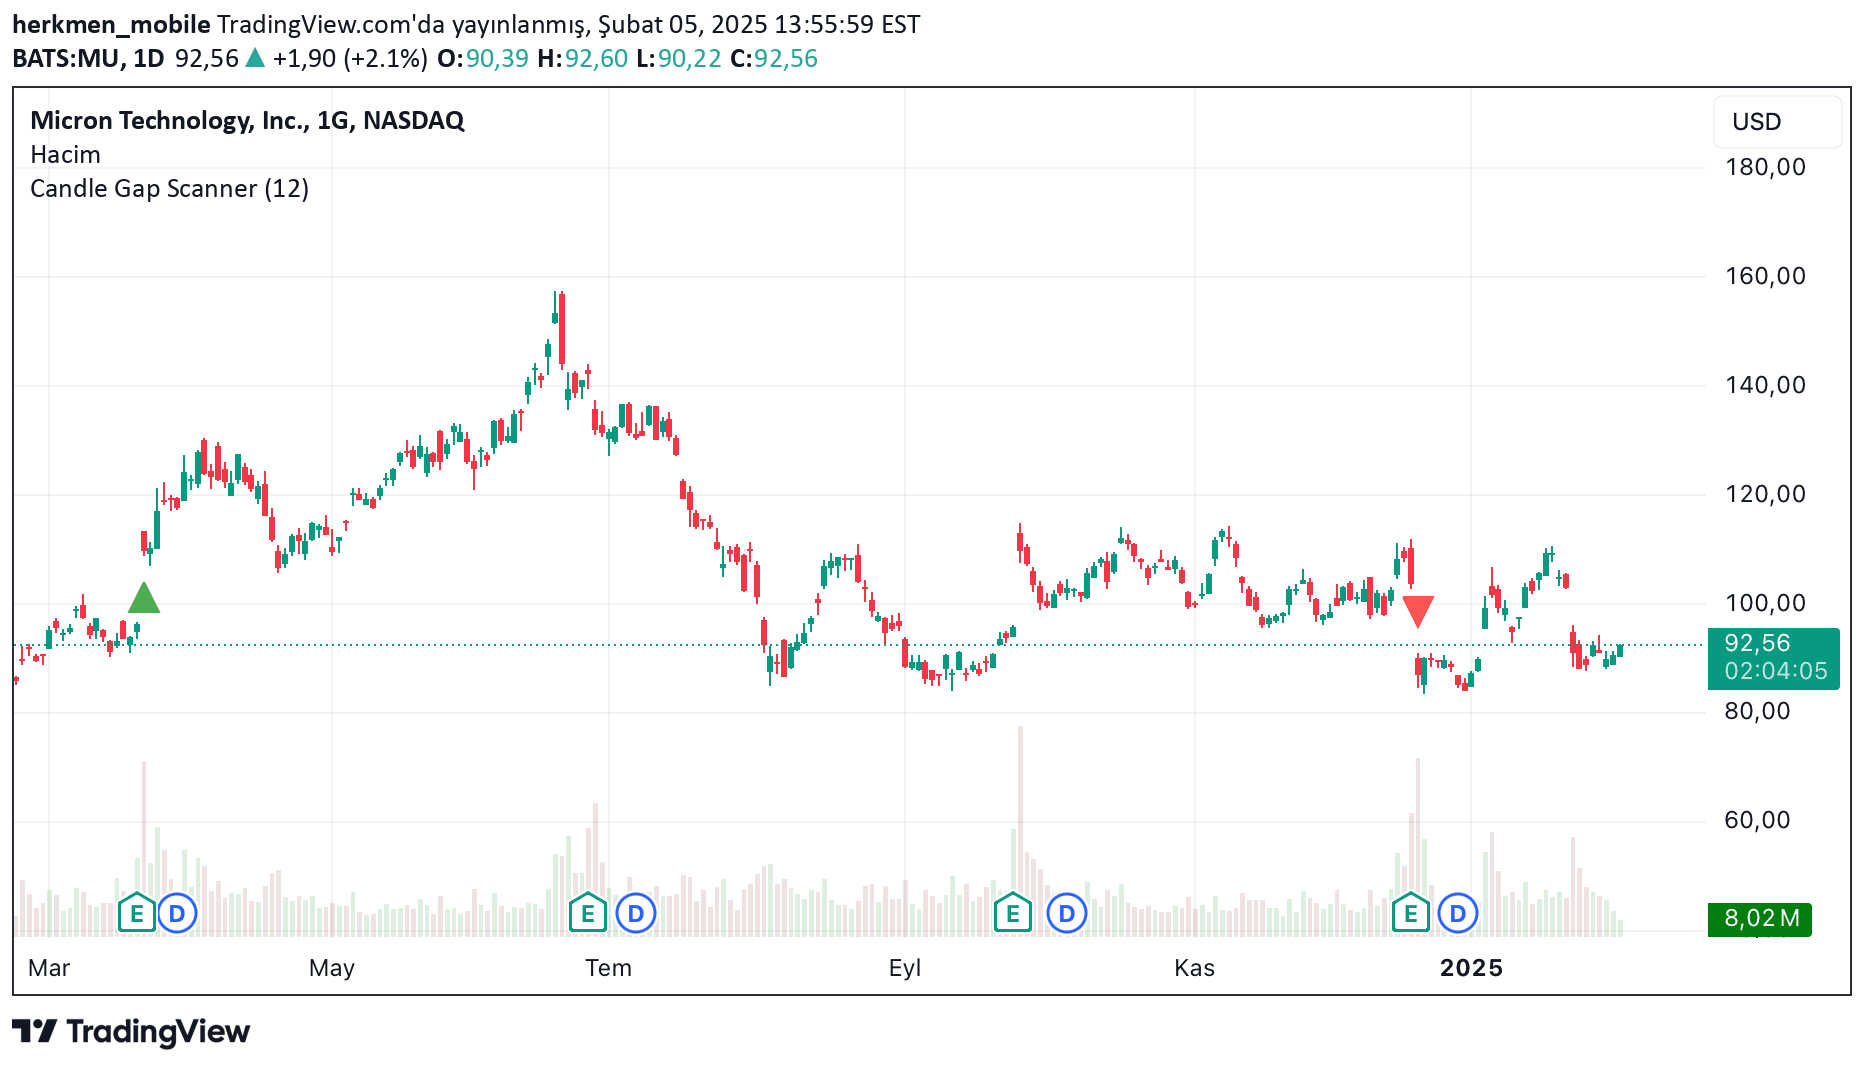
A trading signal that compares price relationships between two consecutive candles, identifying potential market shifts based on percentage-defined price differences.
Explore complementary indicator rolesHow it works
The signal operates by comparing the price ranges of two consecutive candles to detect significant market movements. It first examines whether the highest point of the first candle is lower than the lowest point of the second candle, calculating the percentage difference between these points.
If this difference exceeds a predefined percentage threshold, the signal generates a red mark indicating a potential trading opportunity. Similarly, it also checks the reverse scenario, comparing the lowest point of the first candle against the highest point of the second candle to identify potential market reversals or momentum shifts.
Why it may be useful
This signal provides traders with a systematic method to identify potential price discrepancies and market momentum changes between consecutive candles. By quantifying price differences, it helps traders recognize rapid market shifts that might indicate emerging trends or potential trading opportunities.
The percentage-based approach allows for flexible configuration, enabling traders to adjust sensitivity according to their specific trading strategy and market conditions. This adaptability makes the signal a valuable tool for understanding short-term price dynamics and potential entry or exit points.
When to explore it
The signal is most effective in markets with high volatility and during periods of rapid price movement, such as during economic news releases or significant market events. It works particularly well in shorter timeframes where quick price changes are more pronounced and meaningful.
Traders should consider using this signal in markets with clear directional movements, such as forex, cryptocurrencies, and actively traded stocks. It is especially useful for scalpers and day traders who rely on quick, precise market entry and exit strategies based on short-term price momentum.
Keep exploring
What we’ve verified
Access, alerts and repainting behaviour have not been independently verified for this indicator. Check the creator’s current publication and settings.
General descriptions and classifications are recovered research. Verified details above identify the specific checks we have completed. Check the creator’s current publication for later changes.