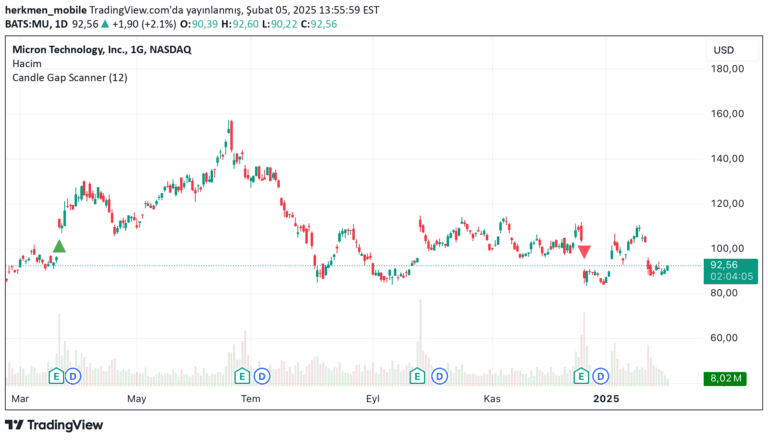
A comprehensive trading indicator that identifies market imbalances, engulfing candles, and momentum patterns to help traders recognize significant price action and potential trading opportunities.
Explore complementary indicator rolesHow it works
The indicator employs multiple detection methods to analyze price action across different market conditions. ATR Imbalance Detection identifies candles with ranges significantly larger than the average true range, using a default multiplier of 1.5 and an ATR length of 5.
Engulfing and Momentum Candle Detection algorithms track specific price movement patterns, including standard and sweep variations. These methods identify bullish and bearish signals by comparing current candle characteristics with previous candle formations, highlighting potential trend reversals or continuations.
Why it may be useful
This indicator provides traders with a comprehensive view of market dynamics by highlighting critical price action signals that might otherwise go unnoticed. By detecting imbalances, engulfing patterns, and momentum shifts, traders can gain insights into potential trend changes and market sentiment.
The multi-dimensional approach allows traders to understand market structure more deeply, potentially improving entry and exit timing. Its visual indicators make complex price action analysis more accessible and intuitive for traders of various skill levels.
When to explore it
The indicator is most effective in markets with clear directional movements and sufficient price volatility. It works particularly well in liquid markets like forex, stocks, and cryptocurrencies where price action is more pronounced and frequent pattern formations occur.
Traders should use this tool in conjunction with other technical analysis methods to confirm signals and reduce false positives. It is especially valuable during trending market conditions and when looking to identify potential trend reversals or continuation patterns.
Keep exploring
What we’ve verified
Access, alerts and repainting behaviour have not been independently verified for this indicator. Check the creator’s current publication and settings.
General descriptions and classifications are recovered research. Verified details above identify the specific checks we have completed. Check the creator’s current publication for later changes.