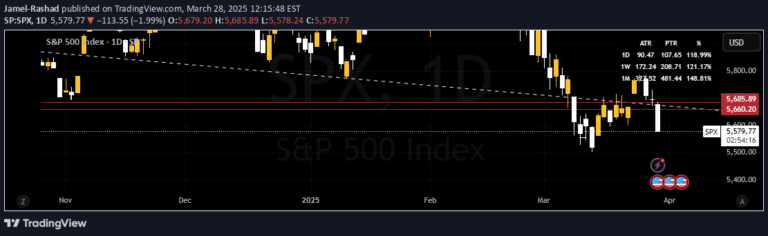
A statistical method using standard deviation to detect price anomalies, identifying potential market turning points by measuring significant deviations from the mean price.
Explore complementary indicator rolesHow it works
The Anomaly Detection indicator calculates a moving average and standard deviation of selected price data over a specified period. It establishes statistical thresholds typically set at three standard deviations above and below the mean, creating upper and lower boundaries for detecting unusual price movements.
When price points exceed these predefined thresholds, the indicator flags them as anomalies, representing potential overbought or oversold market conditions. The method systematically tracks price behavior, automatically plotting threshold lines and labeling significant deviations to help traders quickly identify potential trading opportunities.
Why it may be useful
The Anomaly Detection indicator provides traders with a quantitative approach to understanding market volatility and potential trend reversals. By using statistical measures, it transforms complex price movements into clear, actionable signals that can help traders make more informed decisions about market entry and exit points.
This method offers a systematic way to detect unusual market behavior, reducing emotional decision-making and providing an objective framework for analyzing price fluctuations. The indicator's flexibility in configuring calculation periods and display settings allows traders to customize the tool to their specific trading style and market preferences.
When to explore it
The Anomaly Detection indicator works best in markets with clear trending or cyclical price movements, where statistical deviations can reliably signal potential trend changes. It is particularly effective in liquid markets with sufficient price data, such as major stock indices, forex pairs, and actively traded commodities.
Traders should combine this indicator with other technical analysis tools to confirm signals and reduce false positives. It is most valuable when used alongside momentum indicators, trend analysis, and volume confirmation to create a comprehensive trading strategy that accounts for multiple market dynamics.
Keep exploring
What we’ve verified
Access, alerts and repainting behaviour have not been independently verified for this indicator. Check the creator’s current publication and settings.
General descriptions and classifications are recovered research. Verified details above identify the specific checks we have completed. Check the creator’s current publication for later changes.