
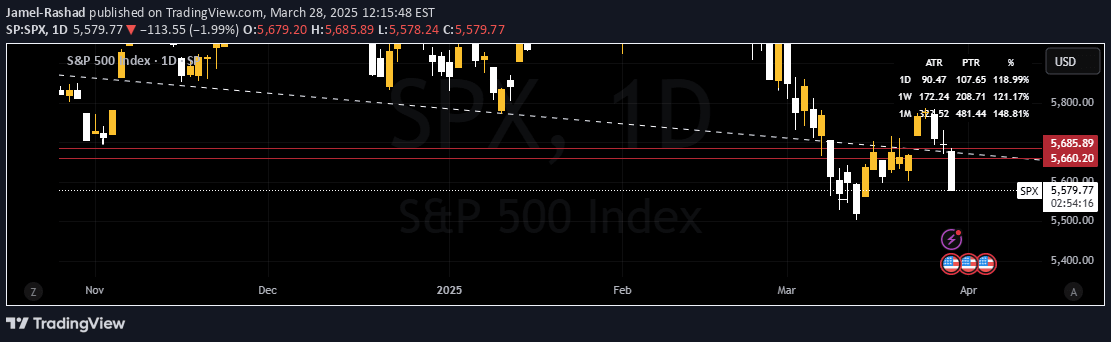
ATR & PTR Table Indicator analyzes market volatility and price trading range across multiple timeframes, helping traders identify potential breakout zones and assess market dynamics.
Explore complementary indicator rolesHow it works
The ATR & PTR Table Indicator calculates the Average True Range (ATR) and Price Trading Range (PTR) across 1-day, 1-week, and 1-month timeframes. It measures market volatility by determining the difference between high and low prices over these periods.
The indicator dynamically updates to show ATR and PTR on the current timeframe. By comparing the typical trading range with the actual traded percentage, traders can understand price movement characteristics. The table provides a comprehensive view of market volatility, enabling traders to assess potential price fluctuations
Why it may be useful
This indicator is crucial for traders because it provides a comprehensive volatility assessment across multiple timeframes. It helps traders understand market dynamics by quantifying price movement ranges and volatility levels. By revealing potential breakout zones, the indicator assists in making more informed trading decisions.
Traders can use this information to adjust their risk management strategies, set appropriate stop-loss and take-profit levels, and identify periods of market consolidation or potential trend changes. The multi-timeframe analysis offers a holistic view of market behavior
When to explore it
The ATR & PTR Table Indicator works best during periods of market transition, such as potential trend reversals or breakouts. It is particularly useful when traders want to assess market volatility before entering a trade.
The indicator is most effective in markets with significant price movements and during times of economic announcements or events. Traders can use it to compare volatility across different timeframes and identify potential trading opportunities. It is especially valuable for swing traders and day traders seeking to understand market dynamics
Keep exploring
What we’ve verified
Access, alerts and repainting behaviour have not been independently verified for this indicator. Check the creator’s current publication and settings.
General descriptions and classifications are recovered research. Verified details above identify the specific checks we have completed. Check the creator’s current publication for later changes.



