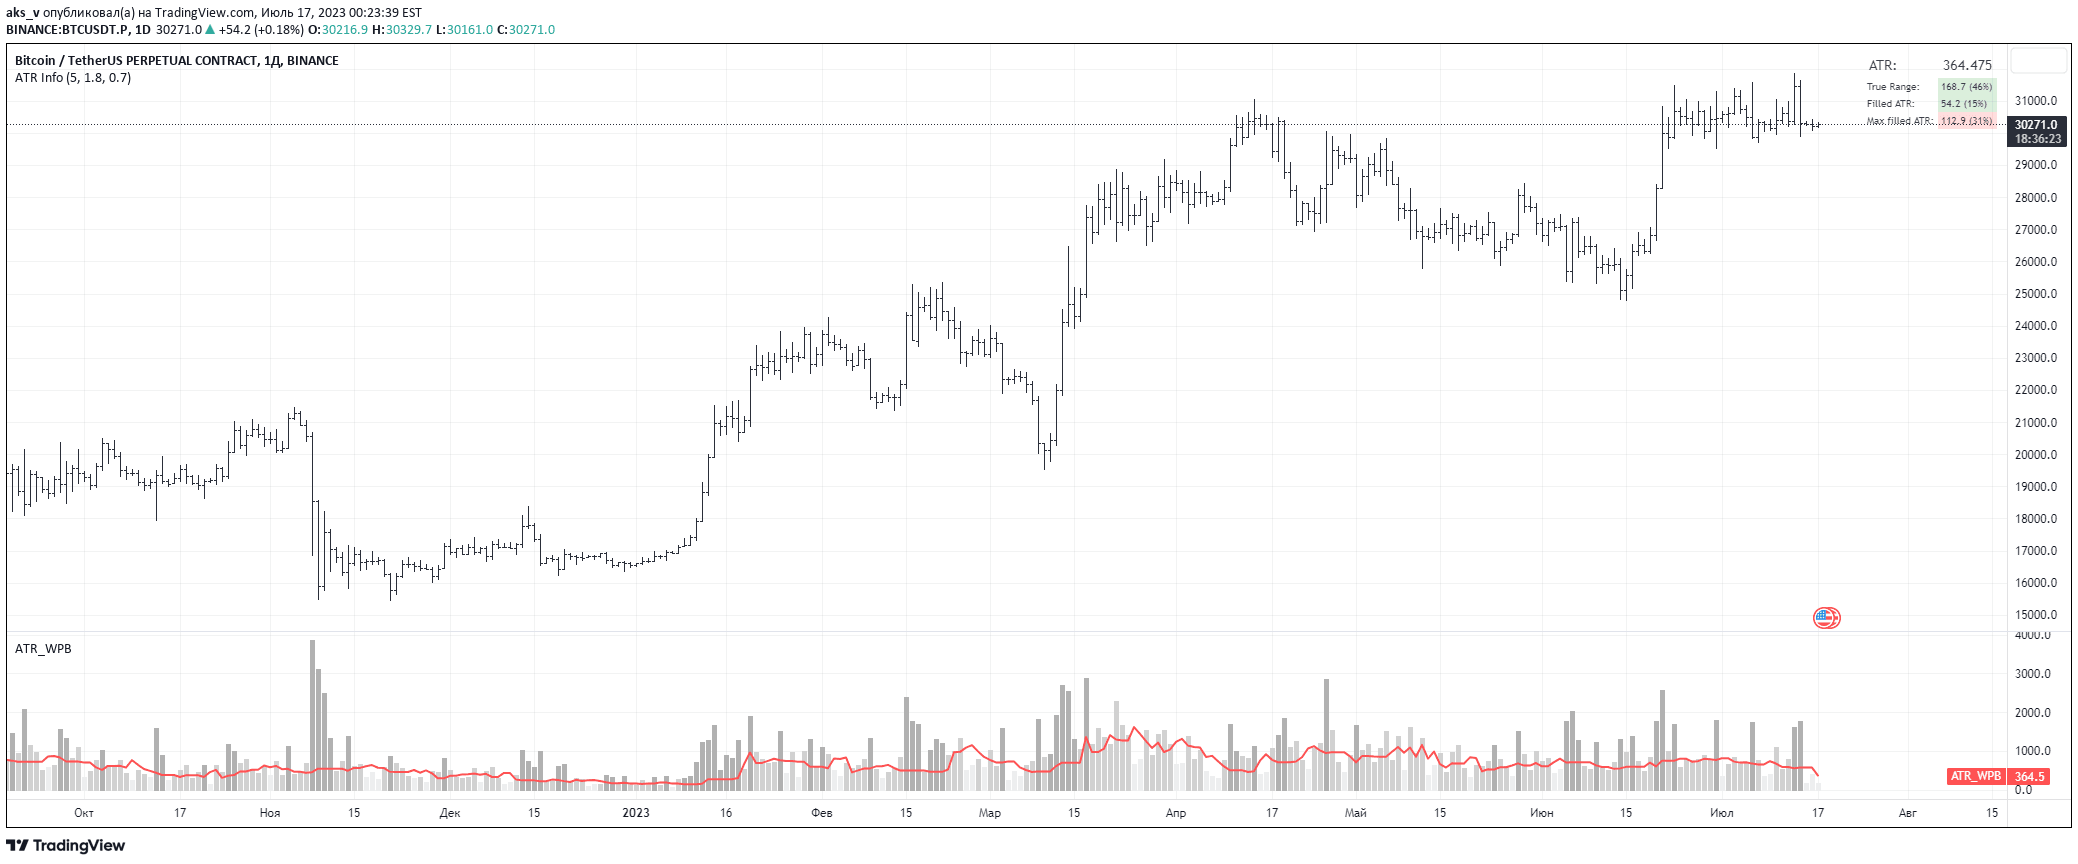
ATR measures market volatility by calculating the average price range over a specific period. It helps traders understand price fluctuations and set appropriate stop-loss and position sizing strategies.
Explore complementary indicator rolesHow it works
The Average True Range (ATR) calculates the average price range of an asset over a specified number of periods, typically 14. It considers the current high and low prices, as well as the previous close price to determine the true range of price movement. The ATR captures volatility by measuring the maximum distance between price points, accounting for gaps and limit moves.
Traders can compute the ATR percentage by dividing the ATR value by the current price and multiplying by 100. This normalized measure allows for easy comparison of volatility across different financial instruments, regardless of their absolute price levels.
Why it may be useful
ATR provides crucial insights into market volatility, helping traders make more informed decisions about risk management and trade execution. By understanding the average price range, traders can set more precise stop-loss levels and determine appropriate position sizes that align with their risk tolerance.
The indicator is valuable because it adapts to changing market conditions, offering a dynamic measure of price fluctuations. It helps traders identify periods of high and low volatility, which can signal potential trading opportunities or times when caution might be necessary.
When to explore it
ATR works best in markets with consistent trading patterns and sufficient liquidity. Traders should use it when they want to adjust their trading strategy based on current market volatility, particularly when setting stop-loss orders or determining position sizes. It is especially useful in trending markets where understanding price range can help manage risk effectively.
The indicator is most powerful when combined with other technical analysis tools, such as trend indicators or momentum oscillators. Traders should be cautious when using ATR in illiquid markets or during periods of extreme market events, as these can produce exaggerated or misleading volatility readings.
Keep exploring
What we’ve verified
Access, alerts and repainting behaviour have not been independently verified for this indicator. Check the creator’s current publication and settings.
General descriptions and classifications are recovered research. Verified details above identify the specific checks we have completed. Check the creator’s current publication for later changes.