A multi-dimensional trading indicator that analyzes price momentum, volume dynamics, and market positioning through proprietary Alpha, Beta, and Gamma metrics.
Explore complementary indicator rolesHow it works
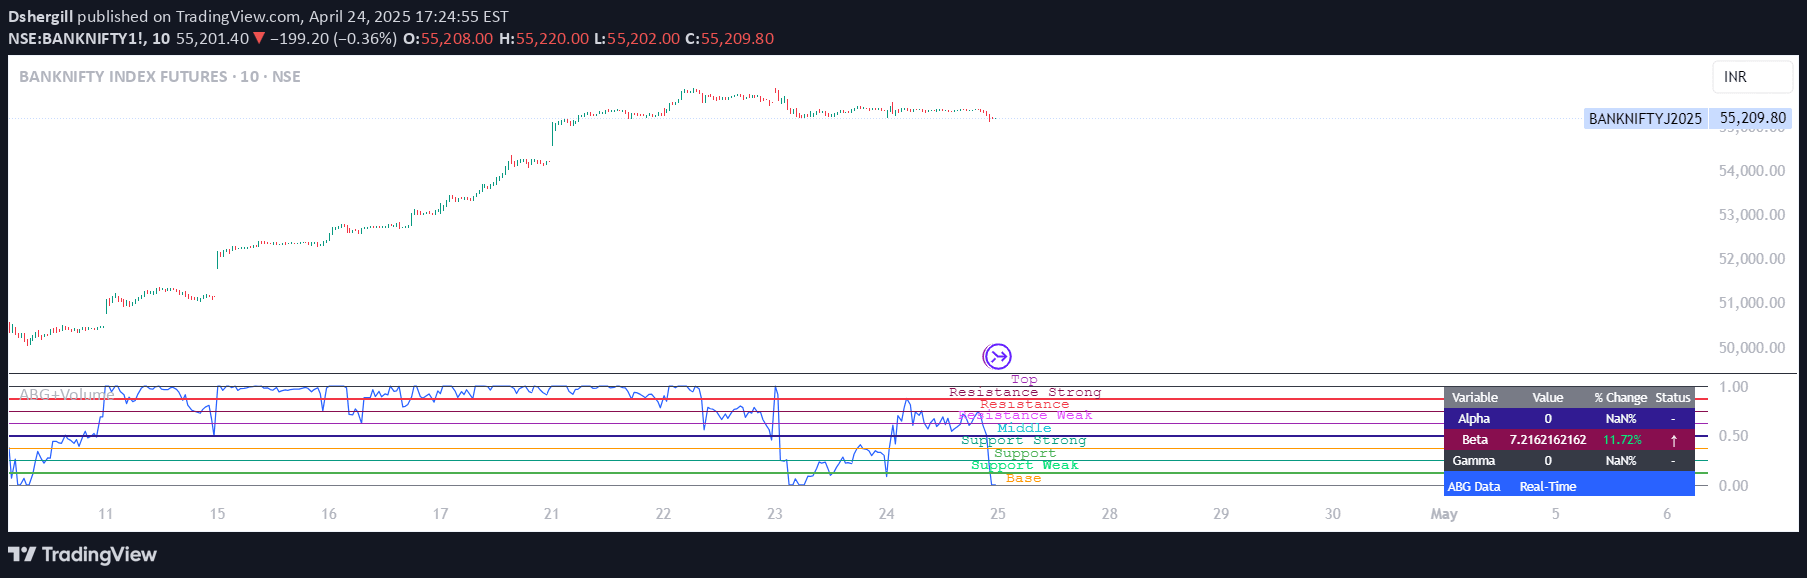
The Alpha Beta Gamma indicator calculates three unique metrics by analyzing price movements relative to historical ranges. Alpha measures the distance of the selected price from the lowest price over a lookback period, normalized by period length. Beta represents the full price range over the lookback period, scaled by period length.
Gamma normalizes the price's position within the high-low range, providing a 0-1 scale for relative market positioning. The indicator simultaneously tracks volume dynamics by classifying candles based on volume thresholds relative to a simple moving average, creating color-coded visual signals for market conditions.
Why it may be useful
This indicator provides traders with a comprehensive view of market dynamics by integrating price momentum, range analysis, and volume insights. By normalizing price movements and volume activity, it offers a nuanced perspective on market strength and potential directional shifts.
The multi-dimensional approach helps traders understand not just price direction, but the underlying momentum and participation. The custom bands and volume-based candle coloration offer additional visual cues for identifying potential entry and exit points. Traders can leverage these insights to make more informed decisions, reducing emotional trading and providing a structured approach to market analysis.
When to explore it
The Alpha Beta Gamma indicator is most effective in markets with clear trending or range-bound characteristics. It performs exceptionally well in liquid markets with consistent volume, such as major forex pairs, stock indices, and high-volume commodities. Traders can adapt its sensitivity by adjusting the lookback period and volume moving average length to suit different trading styles.
For scalpers, using shorter timeframes and reduced ABG lengths can provide rapid market insights. Swing traders might prefer longer periods and more stable volume settings. The indicator is particularly useful during market transitions, helping traders identify potential momentum shifts and volume-driven trend confirmations.
Keep exploring
What we’ve verified
Access, alerts and repainting behaviour have not been independently verified for this indicator. Check the creator’s current publication and settings.
General descriptions and classifications are recovered research. Verified details above identify the specific checks we have completed. Check the creator’s current publication for later changes.