
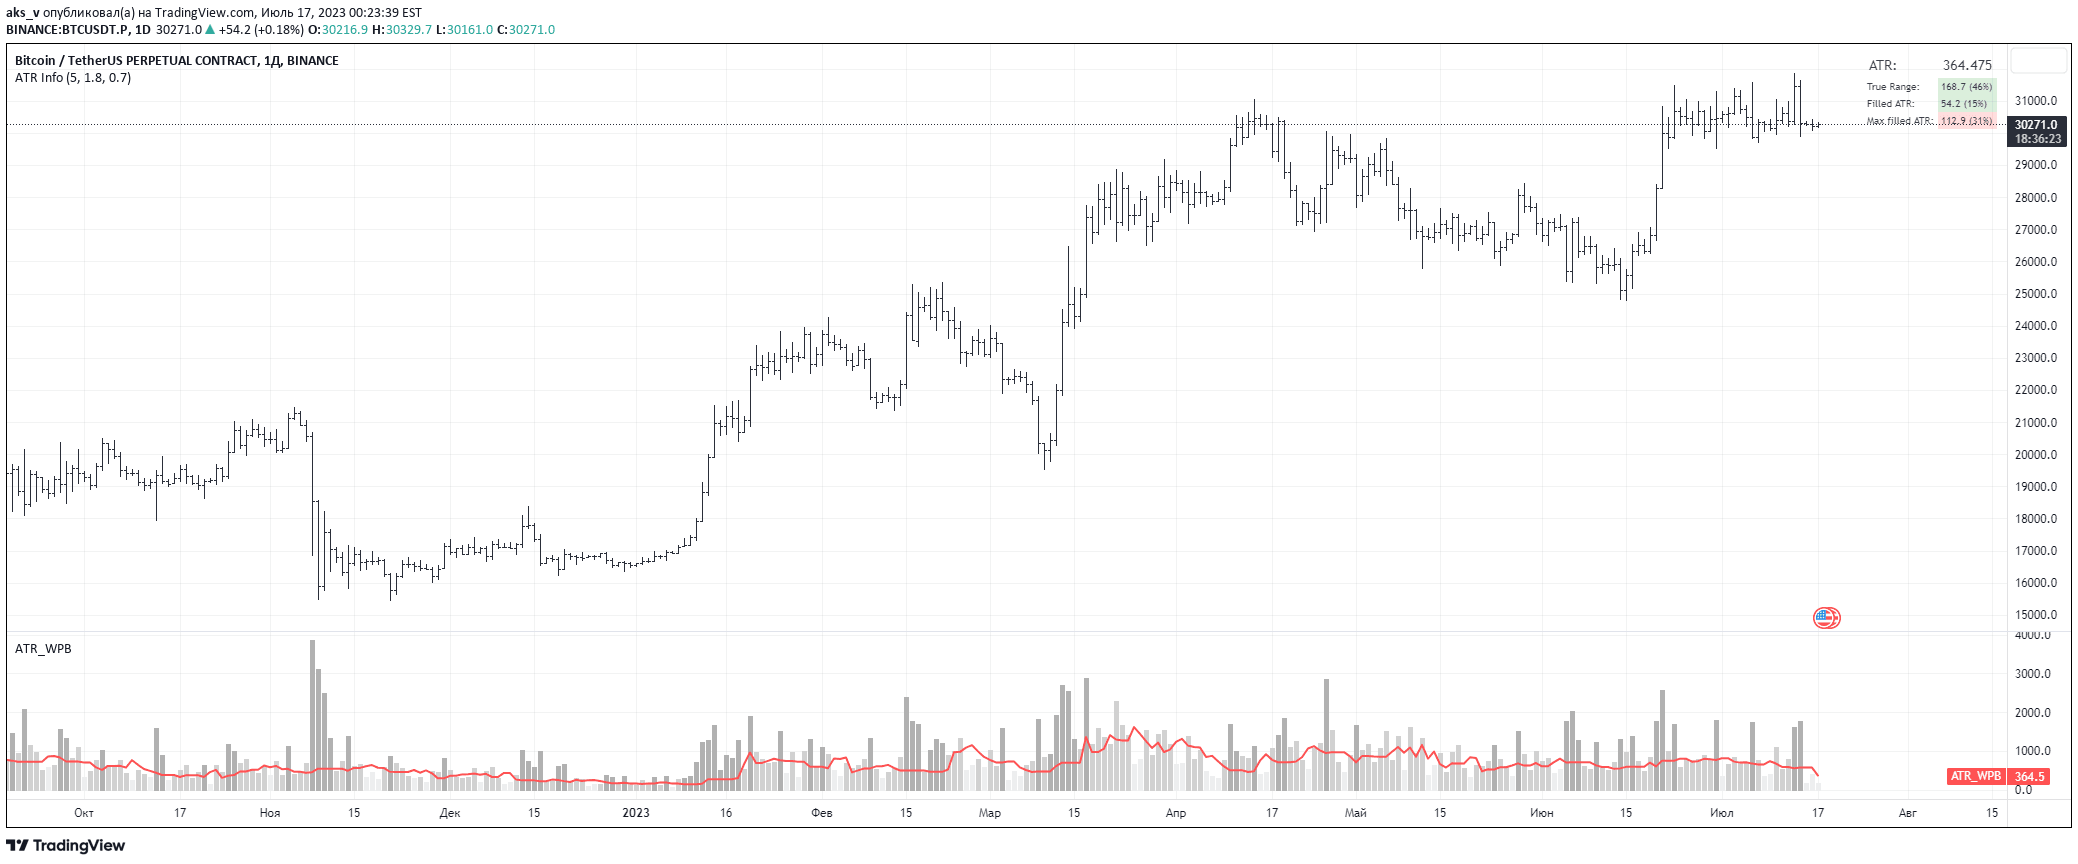
The Average True Range (ATR) is a technical analysis indicator that measures market volatility by decomposing the entire range of an asset's price movement for a specific period.
Explore complementary indicator rolesHow it works
The Average True Range calculates market volatility by analyzing the price range of an asset across multiple periods. It considers the maximum of three price ranges: current high minus current low, current high minus previous close, and current low minus previous close.
The ATR_WPB function specifically calculates the average true range while excluding abnormally large and small bars from the calculation. This refined approach helps traders understand market volatility more accurately by smoothing out extreme price movements and providing a more representative measure of market fluctuations.
Why it may be useful
The ATR is crucial for traders because it provides insights into market volatility, which directly impacts trading strategies and risk management. By understanding the potential price movement range, traders can set more precise stop-loss and take-profit levels, improving their overall trading performance.
Moreover, the ATR helps traders gauge market sentiment and potential trend strength. When the ATR value is low, it suggests limited price movement, while a high ATR indicates significant market volatility and potential trading opportunities.
When to explore it
The Average True Range is most effective when traders want to assess market volatility across different timeframes and asset classes. It works particularly well in markets experiencing significant price fluctuations, such as during economic announcements, earnings reports, or periods of market uncertainty.
Traders should use ATR when developing position sizing strategies, setting stop-loss orders, and identifying potential trend changes. It is especially useful in volatile markets like cryptocurrencies, forex, and stocks with high market capitalization.
Keep exploring
What we’ve verified
Access, alerts and repainting behaviour have not been independently verified for this indicator. Check the creator’s current publication and settings.
General descriptions and classifications are recovered research. Verified details above identify the specific checks we have completed. Check the creator’s current publication for later changes.


