A specialized volatility indicator that separately measures upward and downward market volatility using candle colors, providing unique insights into price movement dynamics.
Explore complementary indicator rolesHow it works
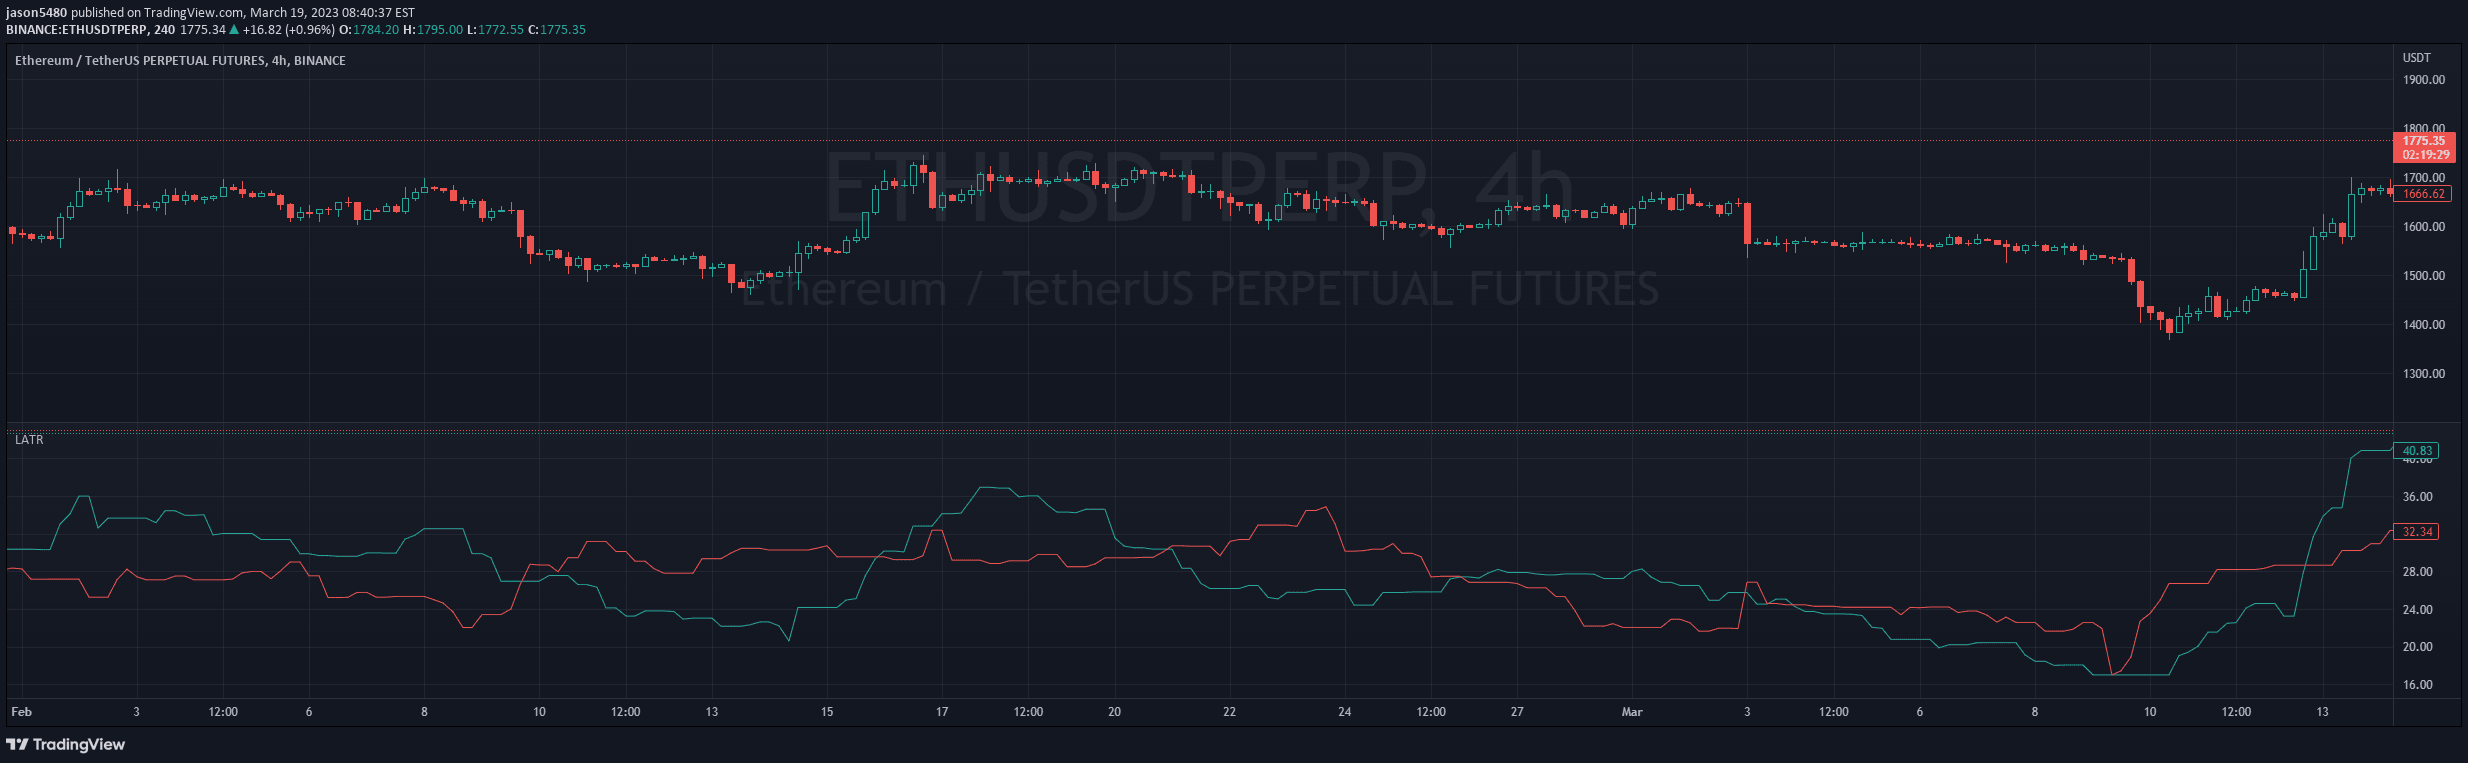
The Ladder ATR indicator calculates volatility by separately analyzing green and red candles, tracking upward and downward price movements. It uses a moving average technique similar to the traditional Average True Range (ATR) but with a distinct approach of segmenting volatility based on candle colors.
By isolating upward and downward volatility, the indicator provides traders with a more nuanced view of market dynamics. Green candles contribute to the upward volatility calculation, while red candles determine the downward volatility, allowing for a more granular understanding of price movement strength and direction.
Why it may be useful
This indicator offers traders a sophisticated method of understanding market volatility beyond traditional measures. By distinguishing between upward and downward price movements, it provides deeper insights into market sentiment and potential trend reversals.
The Ladder ATR helps traders identify potential biases in price movement, enabling more informed decision-making. It can reveal underlying market dynamics that might be obscured by conventional volatility indicators, giving traders a competitive edge in interpreting market behavior.
When to explore it
The Ladder ATR is most effective in markets with clear directional movements and distinct candle color patterns. It works exceptionally well for traders seeking to understand volatility nuances in trending and ranging markets.
Traders should use this indicator when they want to assess potential trend strength, identify potential reversals, and gain a more comprehensive view of market volatility. It is particularly useful in timeframes ranging from short-term scalping to longer-term swing trading strategies.
Keep exploring
What we’ve verified
Access, alerts and repainting behaviour have not been independently verified for this indicator. Check the creator’s current publication and settings.
General descriptions and classifications are recovered research. Verified details above identify the specific checks we have completed. Check the creator’s current publication for later changes.