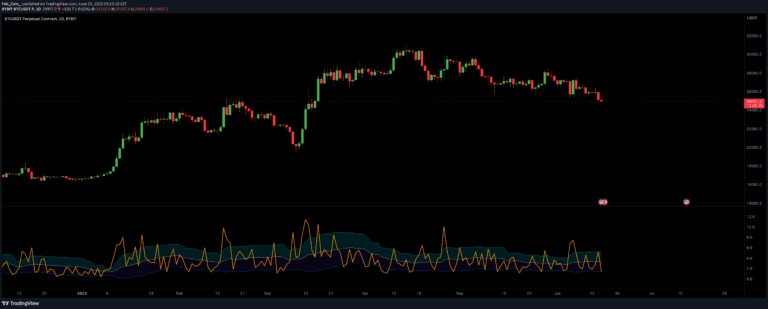
A custom indicator comparing volatility and Average True Range (ATR) to help traders analyze market dynamics, price fluctuations, and potential trend shifts across different asset classes.
Explore complementary indicator rolesHow it works
The Volatility vs ATR indicator operates by simultaneously plotting two key metrics: volatility and Average True Range (ATR) on the same chart. Volatility represents price variation through standard deviation, while ATR measures the average price movement range over a specific period.
By tracking these metrics together, traders can visually compare their interactions and identify market behavior patterns. The indicator uses dual-line display with different colors, typically red for volatility and blue for ATR, enabling easy comparison and analysis of market dynamics.
Why it may be useful
Understanding market volatility and price movement range is crucial for traders seeking to make informed decisions and manage risk effectively. This indicator provides critical insights into market uncertainty, potential trend strength, and momentum shifts by revealing the relationship between price variations and average price ranges.
By offering a comprehensive view of market dynamics, traders can better anticipate potential breakouts, recognize consolidation phases, and develop more strategic trading approaches across various asset classes and market conditions.
When to explore it
The Volatility vs ATR indicator is most effective during periods of market transitions, such as potential trend reversals, breakout scenarios, or when assessing overall market volatility. Traders can leverage this tool to identify significant price movement changes and confirm emerging market trends.
It is particularly useful when evaluating different asset classes, including stocks, forex, cryptocurrencies, and commodities, providing valuable context for trend analysis, risk management, and trade entry/exit decisions.
Keep exploring
What we’ve verified
Access, alerts and repainting behaviour have not been independently verified for this indicator. Check the creator’s current publication and settings.
General descriptions and classifications are recovered research. Verified details above identify the specific checks we have completed. Check the creator’s current publication for later changes.