
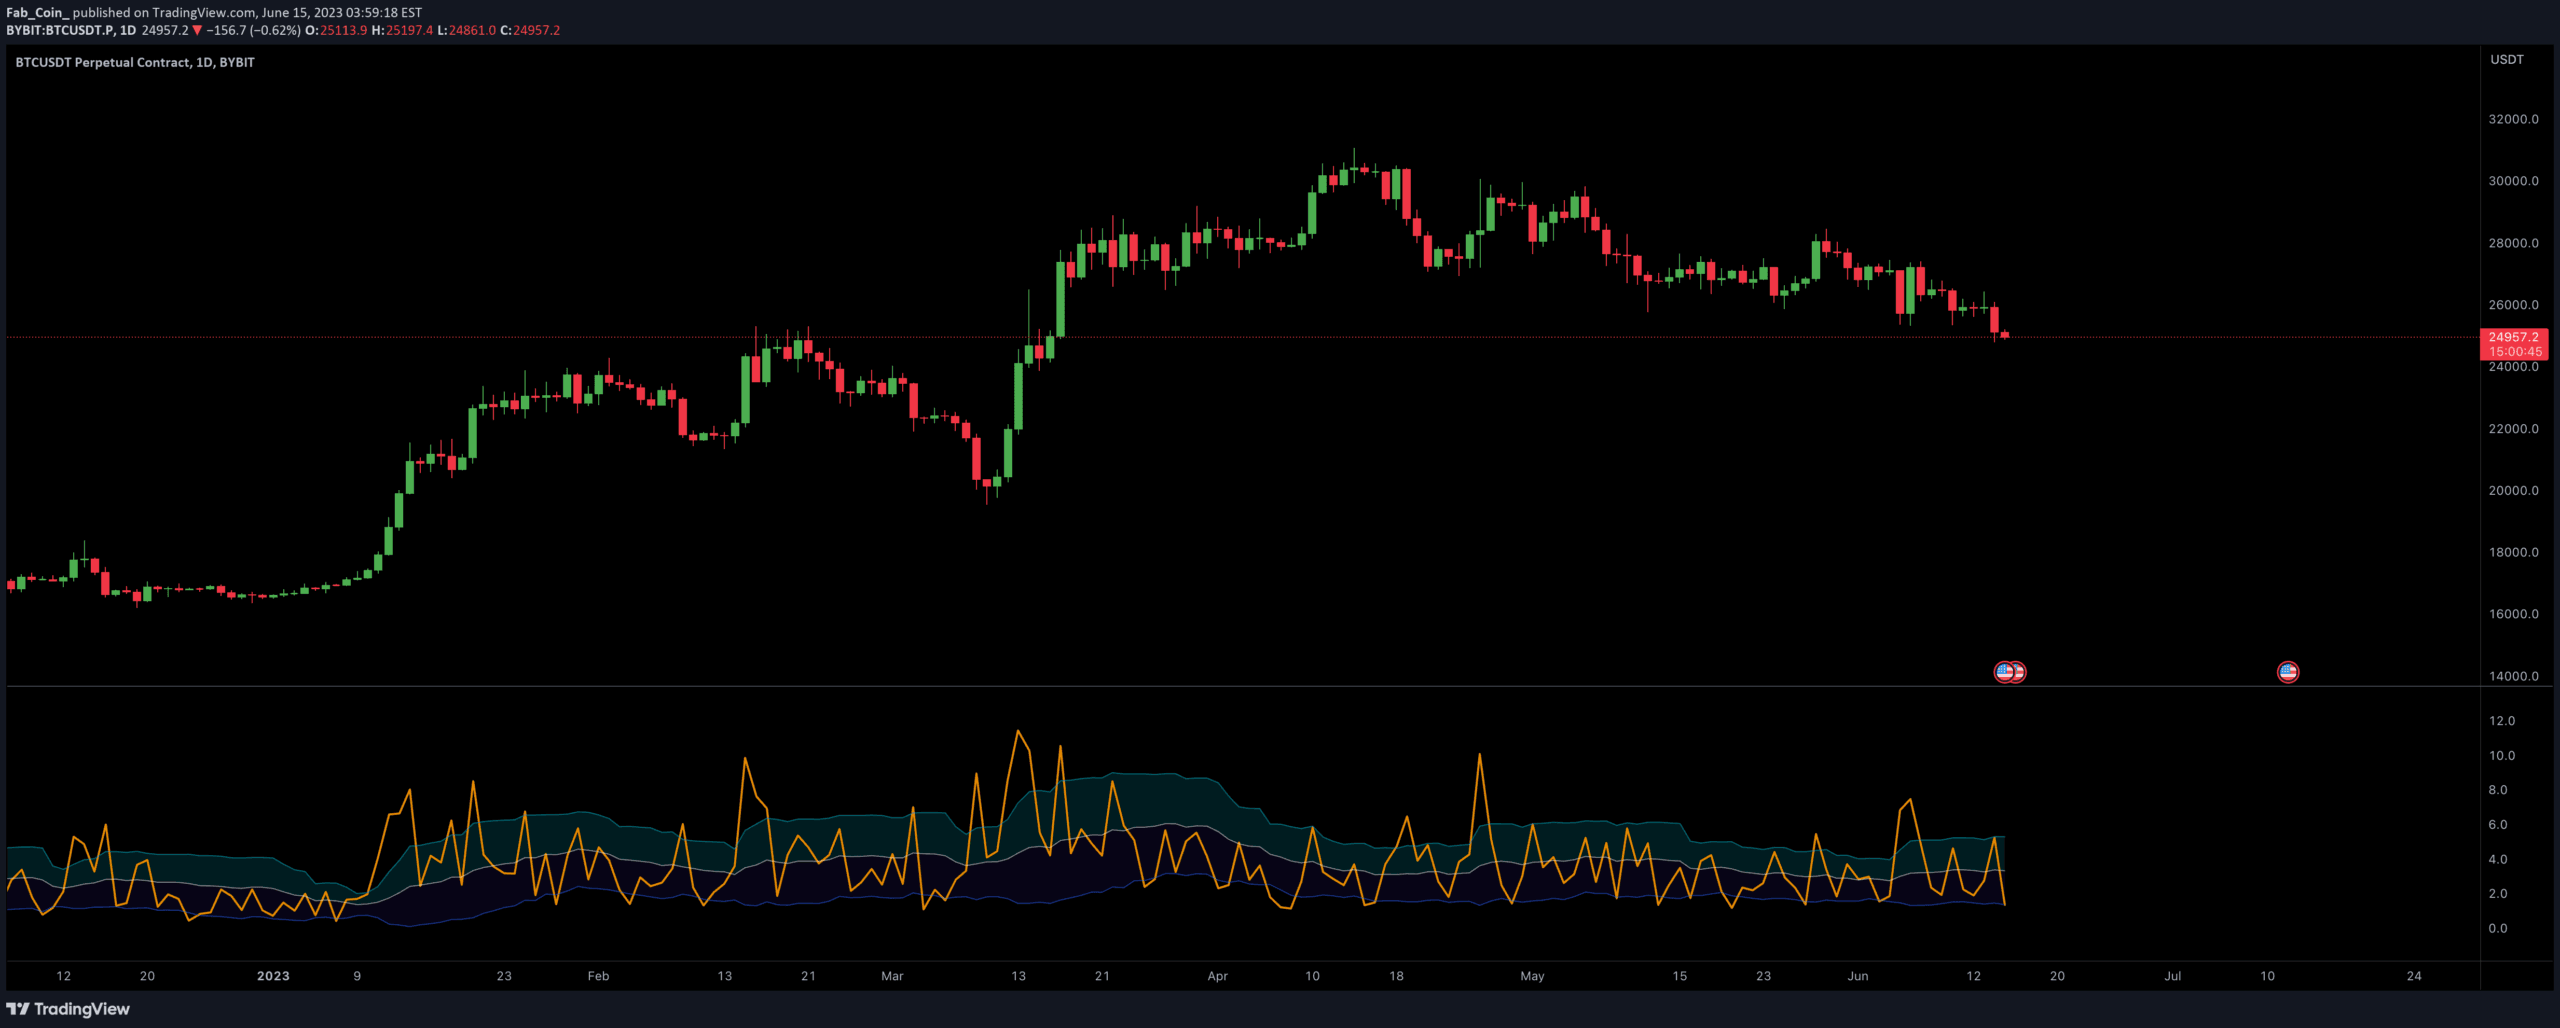
A volatility percentage monitor that tracks asset price fluctuations using moving averages and optional Bollinger Bands, helping traders understand current market movements and potential trend peaks.
Explore complementary indicator rolesHow it works
The Volatility Percentage Monitor (VPM) calculates price fluctuations using Simple Moving Averages to reflect percentage values across different time periods. It provides a default 1-period trend with Bollinger Bands over 20 periods, allowing traders to customize average methods and calculation approaches.
Traders can switch between different average calculation methods like RMA and adjust settings to view short, mid, and long-term volatility trends. The indicator also offers an optional standard deviation graph to help assess data reliability and provide additional insights into market movements.
Why it may be useful
The VPM helps traders quickly understand asset volatility trends by converting complex price movements into easily readable percentage values. By showing how current price moves compare to historical averages, traders can make more informed decisions about potential market entry and exit points.
The indicator's flexibility in calculating averages and displaying volatility trends across different timeframes makes it a versatile tool for analyzing market behavior. Its ability to integrate Bollinger Bands and standard deviation measurements provides traders with multiple layers of market analysis in a single indicator.
When to explore it
The Volatility Percentage Monitor is most effective during periods of significant market movement when understanding price fluctuations becomes crucial for trading decisions. It works particularly well in day trading scenarios where quick assessment of market volatility can inform rapid trading strategies.
Traders should use the VPM when they want to assess market volatility across daily, weekly, or monthly timeframes, and when they need a comprehensive view of price movement trends. It is especially useful for identifying potential trend peaks and understanding the reliability of current market data.
Keep exploring
What we’ve verified
Access, alerts and repainting behaviour have not been independently verified for this indicator. Check the creator’s current publication and settings.
General descriptions and classifications are recovered research. Verified details above identify the specific checks we have completed. Check the creator’s current publication for later changes.


