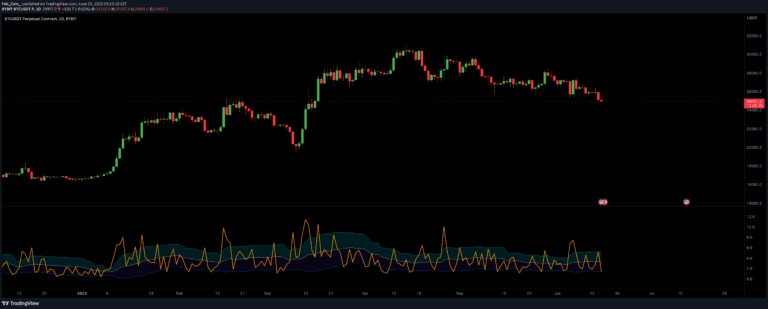
A logarithmic volatility indicator that uses EMA lengths to analyze market volatility, providing real-time insights into price movements, especially in low volatility environments.
Explore complementary indicator rolesHow it works
The Logarithmic Volatility Indicator calculates market volatility using logarithmic principles and multiple Exponential Moving Average (EMA) lengths. It combines opening, high, low, and closing prices to create a unique volatility estimator based on mathematical models developed by Parkinson, Garman, and Klass.
The indicator uses three EMA lengths - fast, medium, and slow - to provide a comprehensive analysis of market dynamics. By comparing these different EMA lengths, the indicator generates color-coded signals that represent changes in volatility, allowing traders to quickly interpret market conditions and potential price movements.
Why it may be useful
This indicator is crucial for traders seeking to understand market volatility, especially in low-activity trading environments. It provides a sophisticated mathematical approach to measuring price fluctuations, offering traders a nuanced view of market dynamics that goes beyond simple visual analysis.
By integrating multiple EMA lengths and using color-coded visualization, the Logarithmic Volatility Indicator helps traders make more informed decisions. It transforms complex volatility calculations into an intuitive format, enabling both novice and experienced traders to quickly assess market conditions and potential trading opportunities.
When to explore it
The Logarithmic Volatility Indicator is most effective in low volatility markets where price movements are less pronounced and harder to predict. It works exceptionally well for traders who want to capture subtle changes in market dynamics and need a tool that provides real-time insights into potential trend shifts.
Traders should use this indicator in conjunction with other analytical tools and risk management strategies. It is particularly useful for short-term trading strategies like scalping and day trading, where understanding immediate market volatility can provide a critical edge in decision-making.
Keep exploring
What we’ve verified
Access, alerts and repainting behaviour have not been independently verified for this indicator. Check the creator’s current publication and settings.
General descriptions and classifications are recovered research. Verified details above identify the specific checks we have completed. Check the creator’s current publication for later changes.