
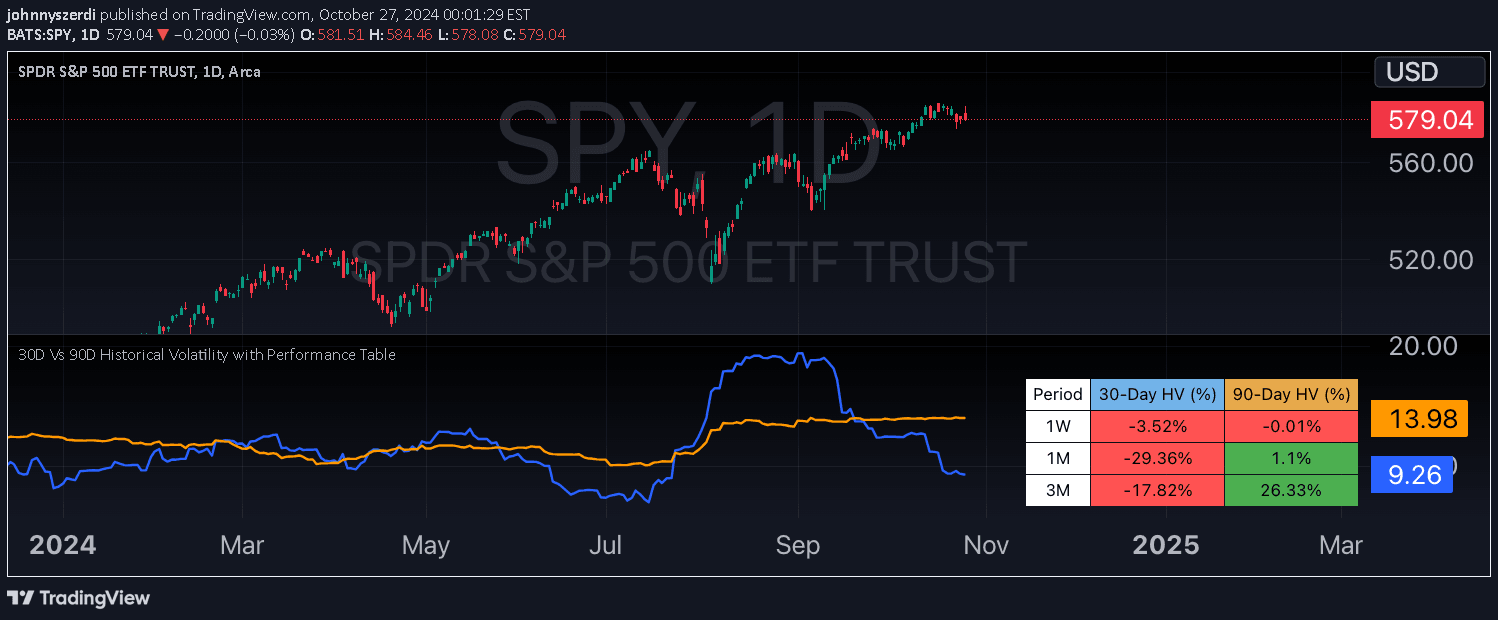
A volatility analysis comparing 30-Day and 90-Day Historical Volatility to predict potential market trends and price movements through crossover and divergence patterns.
Explore complementary indicator rolesHow it works
Historical volatility measures price fluctuations over specific time periods, comparing 30-day and 90-day intervals to assess market dynamics. When the 30-day volatility crosses under the 90-day volatility, it signals a potential bullish trend emerging in the asset's price movement.
The signal tracks volatility changes by analyzing how quickly and dramatically prices have been changing over different timeframes. Traders monitor these crossover points and volatility peaks or troughs to identify potential trend reversals and market sentiment shifts.
Why it may be useful
Volatility is a critical indicator of market risk and potential price movement, providing traders with insights into underlying asset behavior. Understanding volatility helps traders anticipate potential trend changes and make more informed trading decisions based on historical price fluctuations.
By comparing different volatility timeframes, traders can gain a more nuanced view of market dynamics, potentially identifying emerging trends before they become fully established. This approach allows for more strategic entry and exit points in trading strategies.
When to explore it
This volatility signal works best in markets with clear trending characteristics and moderate price movements. It is particularly effective in liquid markets where historical price data provides reliable insights into potential future trends.
Traders should use this signal in conjunction with other technical indicators to confirm potential trend changes. It is most valuable when applied to assets with consistent trading patterns and when combined with comprehensive market analysis.
Keep exploring
What we’ve verified
Access, alerts and repainting behaviour have not been independently verified for this indicator. Check the creator’s current publication and settings.
General descriptions and classifications are recovered research. Verified details above identify the specific checks we have completed. Check the creator’s current publication for later changes.


