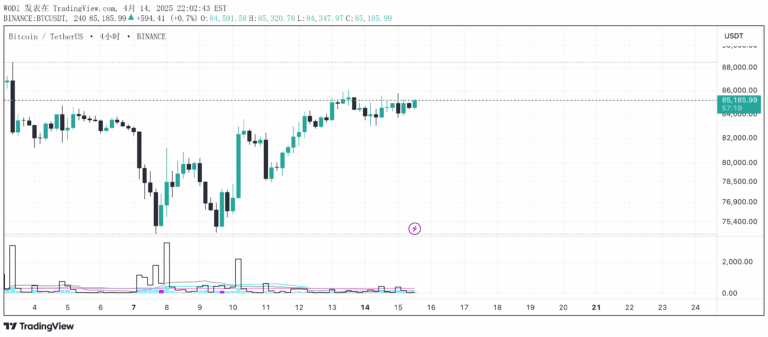
A normalized volume and volatility indicator that compares current bar data to historical sessions, helping traders identify statistically significant market activity and potential price movements.
Explore complementary indicator rolesHow it works
The indicator calculates normalized volume or volatility by comparing the current bar's value to historical data from the same time period. It uses a statistical approach, comparing the current bar against a baseline calculated from previous sessions' equivalent bars, typically using mean plus three standard deviations.
The core formula normalizes each bar by dividing the current bar's value by a statistical basis and scaling it, allowing traders to see how the current bar's volume or volatility compares to what's considered normal. Users can choose between volume and volatility, and display results as a ratio or percentage.
Why it may be useful
This indicator provides a more nuanced view of market activity by contextualizing current volume and volatility against historical data. It helps traders distinguish between typical market fluctuations and truly significant movements, reducing the likelihood of false signals and improving trade decision-making.
By offering both volume and volatility measurements, traders can gain deeper insights into market dynamics, understanding not just price movement but the underlying energy and potential momentum behind those movements. The ability to correlate volume and volatility can provide additional layers of market analysis.
When to explore it
The indicator is most effective during active trading sessions where consistent historical data is available, particularly for traders seeking to understand intraday market dynamics. It works best when there's a substantial sample of historical bars to create a reliable statistical baseline, making it particularly useful for day trading and shorter-term strategies.
Traders should use this tool when they want to objectively assess whether current market activity is statistically significant or just typical noise. It's especially valuable during potential breakout scenarios, trend confirmations, and when evaluating the strength of price movements relative to historical norms.
Keep exploring
What we’ve verified
Access, alerts and repainting behaviour have not been independently verified for this indicator. Check the creator’s current publication and settings.
General descriptions and classifications are recovered research. Verified details above identify the specific checks we have completed. Check the creator’s current publication for later changes.